
0:00 / 0:00
Solving Graphically
One method for solving a system of linear equations is to first graph them, and visually see where the lines meet (cross over).

Example
Solve the simultaneous equations .
Graphing
Let's first rearrange both equation into the slope y-intercept form :
First equation:
- y-intercept:
- Slope: (up 3, right 1)
Second equation:
- y-intercept:
- Slope: (down 2, right 1)
We get this graph:
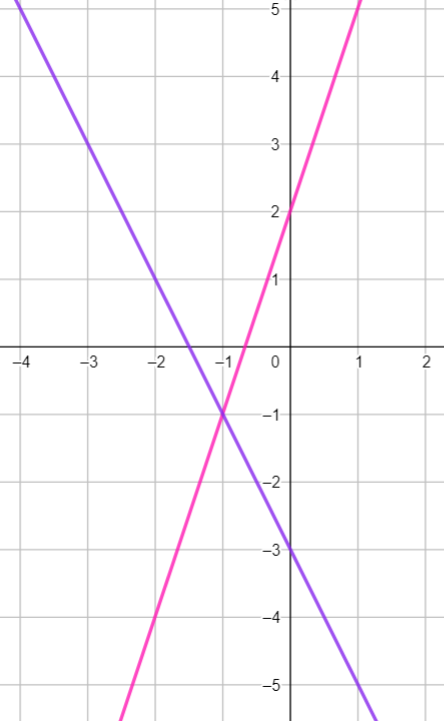
Finding the Point of Intersection
From the graph, we see that the lines meet at the point .
Check Your Answer
We can confirm this by inserting the solution into the original equations.
Equation 1:
Equation 2:

0:00 / 0:00
Example: Solving Graphically
Find the solution to the system of linear equations which includes the following lines.
First put both in a form where the lines can be easily graphed.
- becomes (Note this is a vertical line so it is easily graphed)
- becomes
Next, graph the two lines.

Find the solution where the lines meet.
The solution is .
Practice: Solving Graphically
a) Graph the lines and .
b) Determine the point of intersection between the lines and .
Practice: Solving Graphically
Find the point of intersection between the lines and
Practice: Solving Graphically
Find the point of intersection between the line and the line perpendicular to it which also has a y-intercept of 2.