Create a free account to get started

Unlock full course notes by signing up

  • Video lessons taught by top educators
  • Practice questions with guided solutions
  • Written review notes for reference
  • Expert answers anytime from course tutors

Confidence Interval for Linear Regression

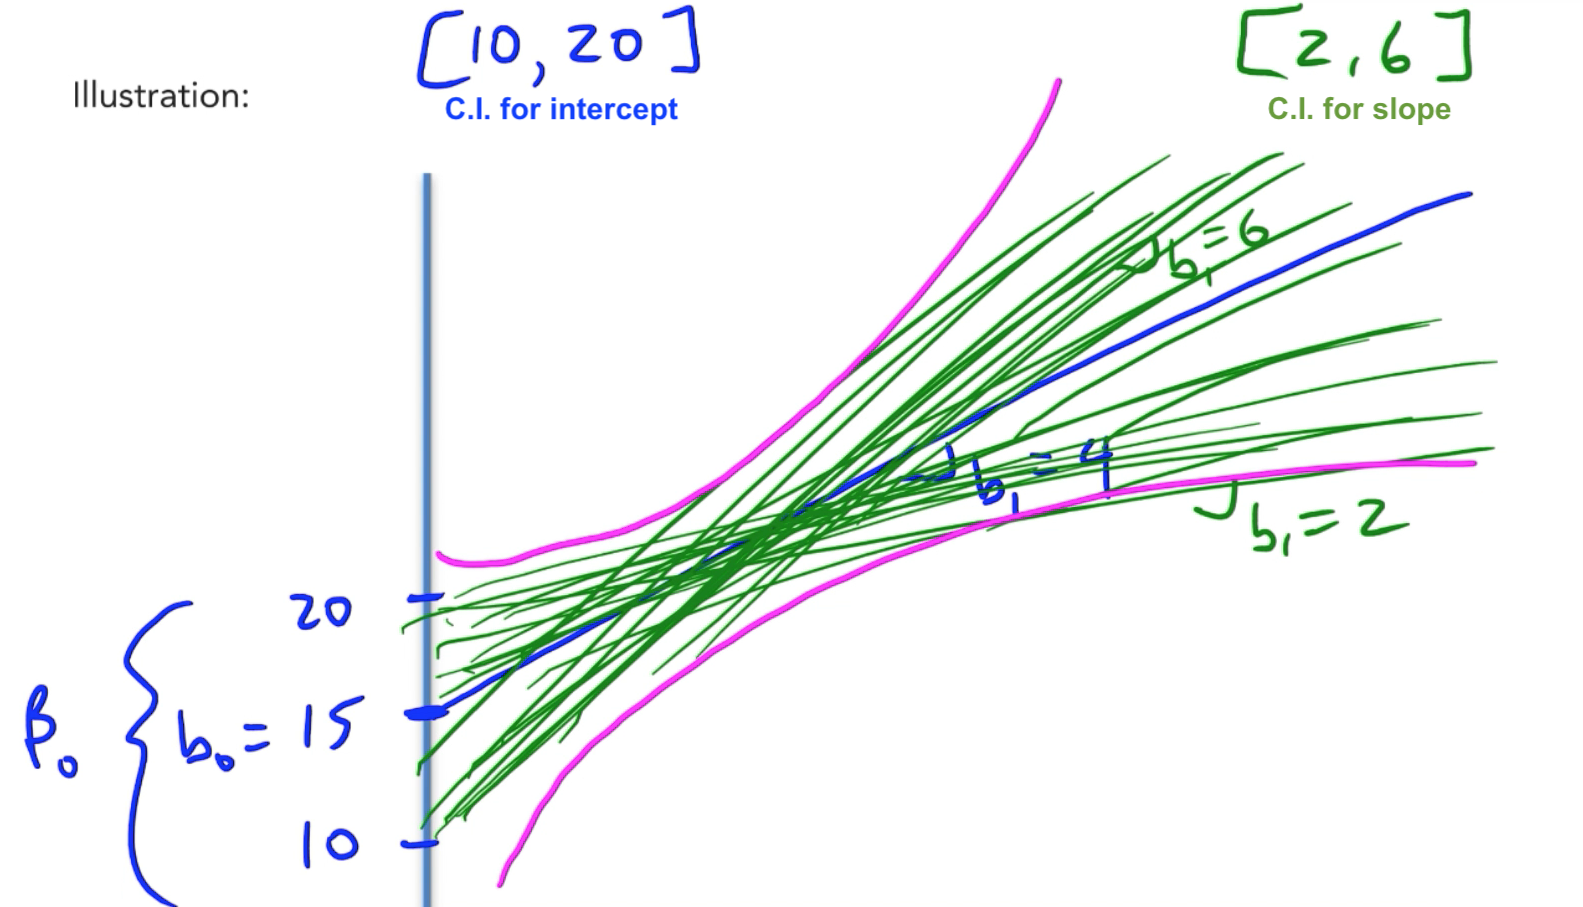
The slope of the population line β1\beta_1 is the most important parameter in regression. The slope measures the change of YY for every addition one unit increase in XX.


The population slope β1\colorFour{\beta_1} is the parameter we are trying to estimate using the sample slope b1\colorFour{b_1}, which is the statistic or point estimate.


[point estimate]±[MOE][point \ estimate]\pm[MOE]


[LCL]←[point estimate]→ [UCL]\left[LCL\right]\leftarrow\left[point\ estimate\right]\rightarrow\ \left[UCL\right]


A confidence interval is a range of values, based on the sample data, that is used to estimate an unknown population parameter – in this case, the population mean – at a given confidence level – usually 90%, 95%, or 99%.
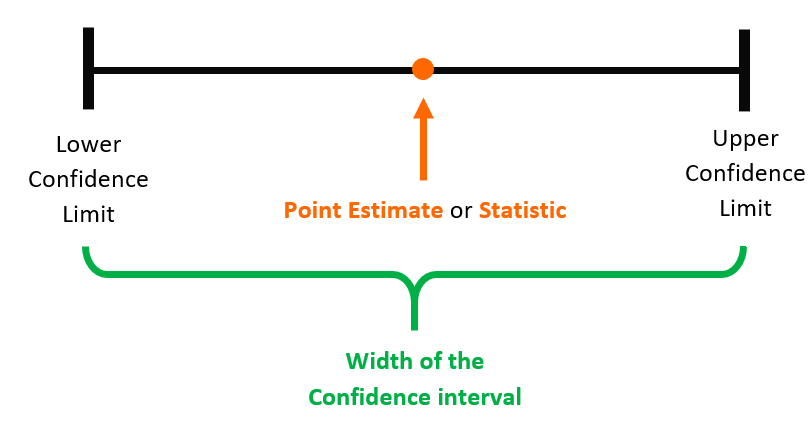

Image illustrating Confidence Interval for Linear Regression


Formulas

Image illustrating Confidence Interval for Linear Regression

df=n−k−1df=n-k-1


Example


Image illustrating Confidence Interval for Linear Regression


Image illustrating Confidence Interval for Linear Regression


Create a free account to get started

Unlock full course notes by signing up

  • Video lessons taught by top educators
  • Practice questions with guided solutions
  • Written review notes for reference
  • Expert answers anytime from course tutors

Example: Confidence Interval for Regression
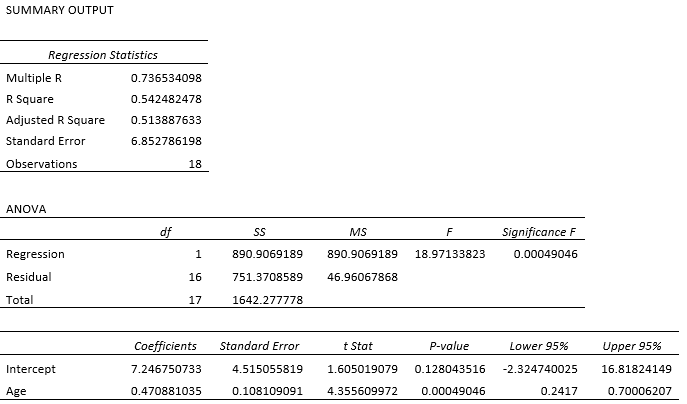

Image illustrating Example

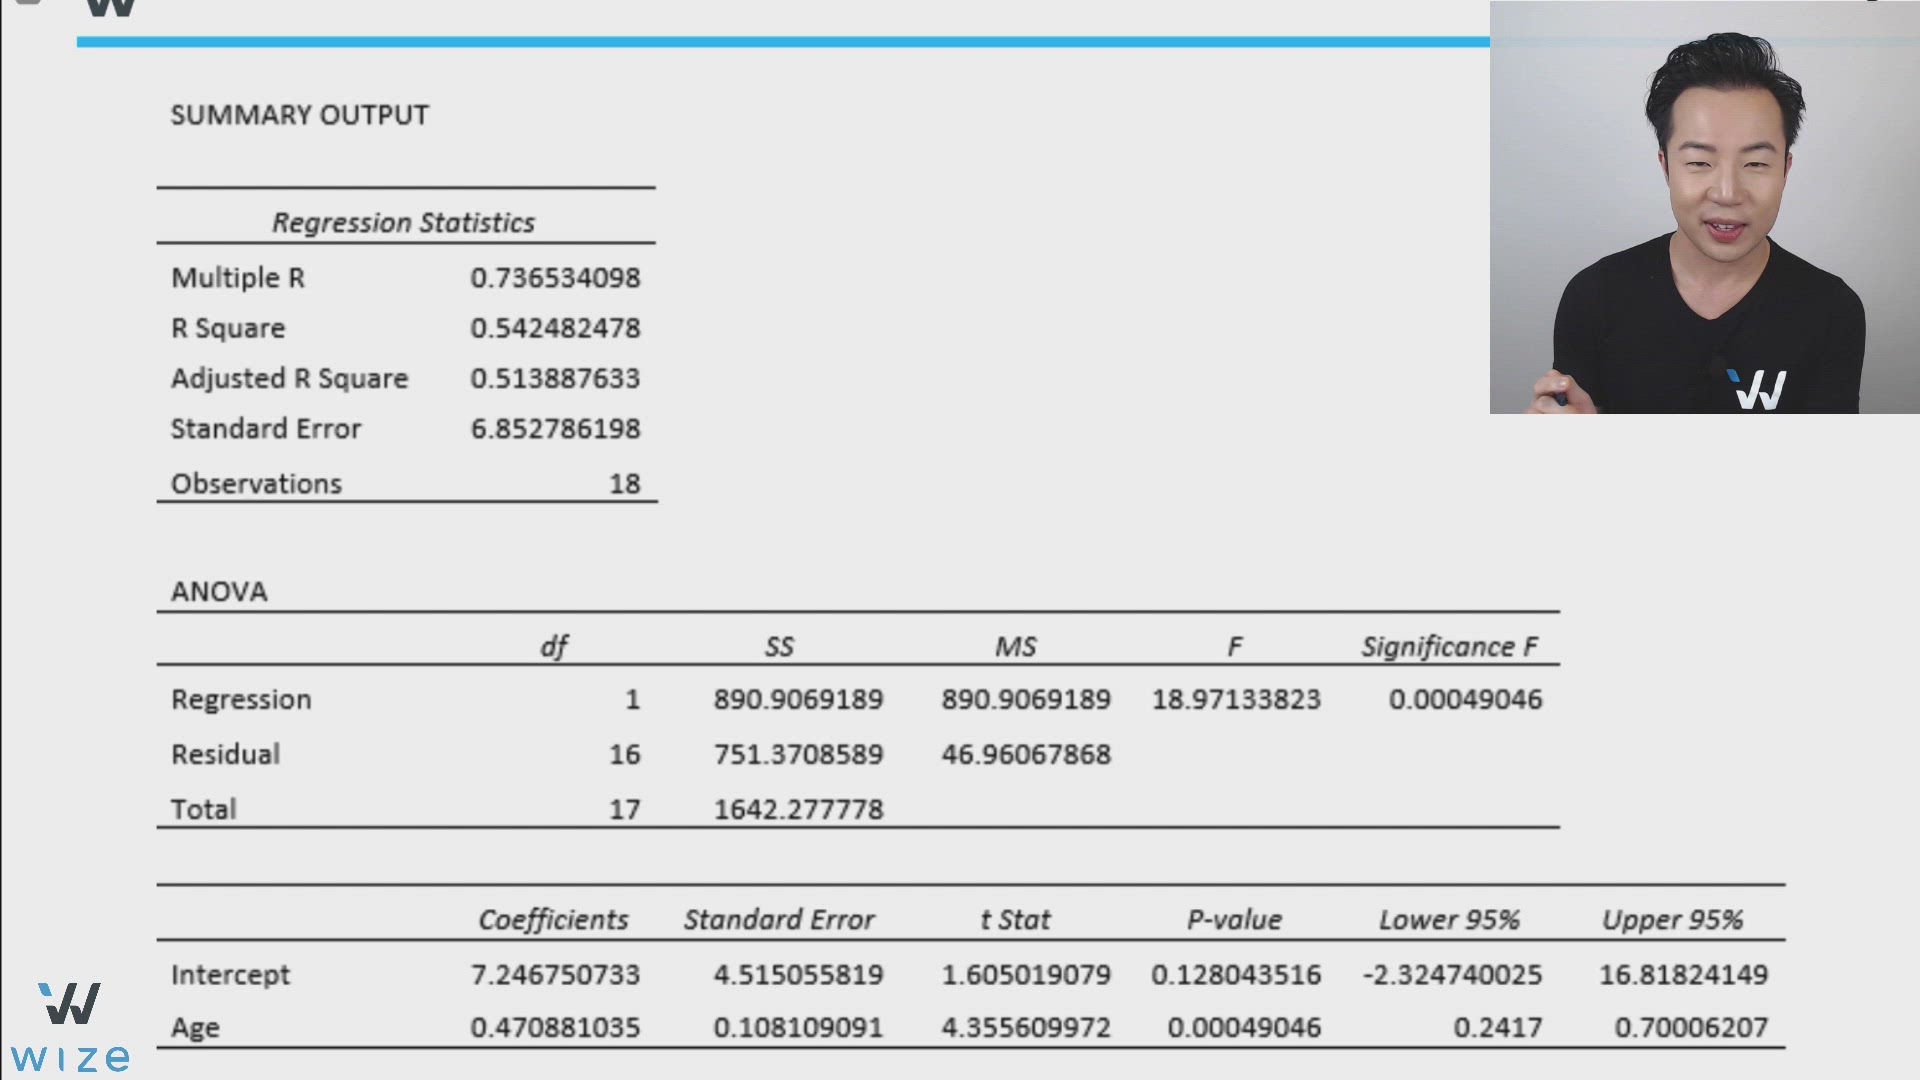
(a) Construct a 95% confidence interval for the true unknown population interceptβo{\beta}_o.


df=n−k−1=18−1−1=16df=n-k-1=18-1-1=16


t∗=2.12t^{\ast}=2.12 [Use t-table to find this value.]


bo±t∗SE(bo)b_o\pm t^{\ast}SE\left(b_o\right)


7.247±2.12(4.515)7.247\pm2.12\left(4.515\right)


[−2.32, 16.82]\left[-2.32,\ 16.82\right]


We are 95% confident that the true population intercept is in that interval.


Image illustrating Example


(b) Construct a 95% confidence interval for the true unknown population slope β1{\beta}_1.


b1±t∗SE(b1)b_1\pm t^{\ast}SE\left(b_1\right)


0.4709±2.12(0.1081)0.4709\pm2.12\left(0.1081\right)


[0.242, 0.700]\left[0.242,\ 0.700\right]


We are 95% confident that the true population slope is in that interval.


You can see the confidence intervals for both intercept and slope at the bottom right part of the ANOVA table.
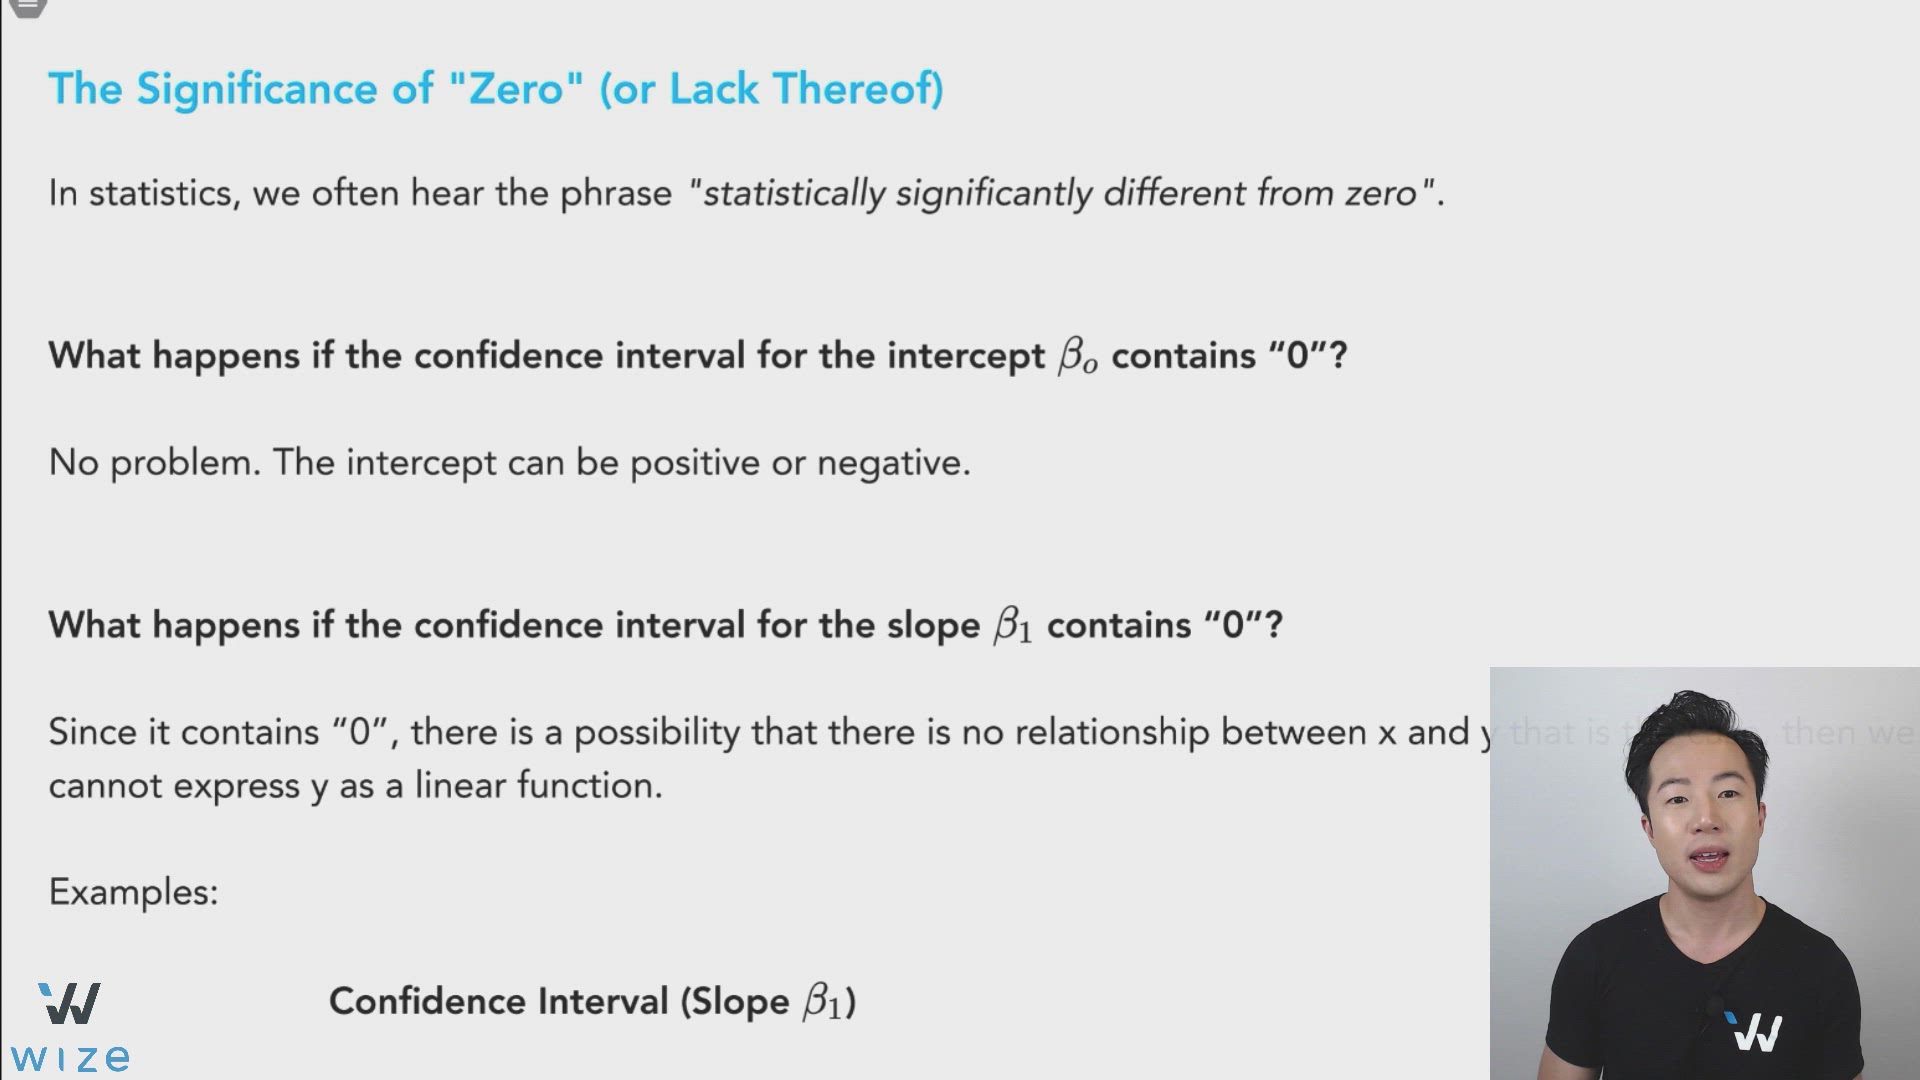

Illustration for practice question: Confidence Interval for Linear Regression


There are 42 observations for this linear regression model to estimate a movie's rating (YY) based on its box office gross earnings (XX).


Construct a 95% confidence interval to estimate the population slope β1\beta_1.

Choose an answer

Create a free account to get started

Unlock full course notes by signing up

  • Video lessons taught by top educators
  • Practice questions with guided solutions
  • Written review notes for reference
  • Expert answers anytime from course tutors

Create a free account to get started

Unlock full course notes by signing up

  • Video lessons taught by top educators
  • Practice questions with guided solutions
  • Written review notes for reference
  • Expert answers anytime from course tutors

Slope: The Significance of "Zero" (or Lack Thereof)

In statistics, we often hear the phrase "statistically significantly different from zero".


What happens if the confidence interval for the intercept βo\colorOne{\beta_o} contains “0”?

No problem. The intercept can be positive or negative.


What happens if the confidence interval for the slope β1\colorOne{\beta_1} contains “0”?

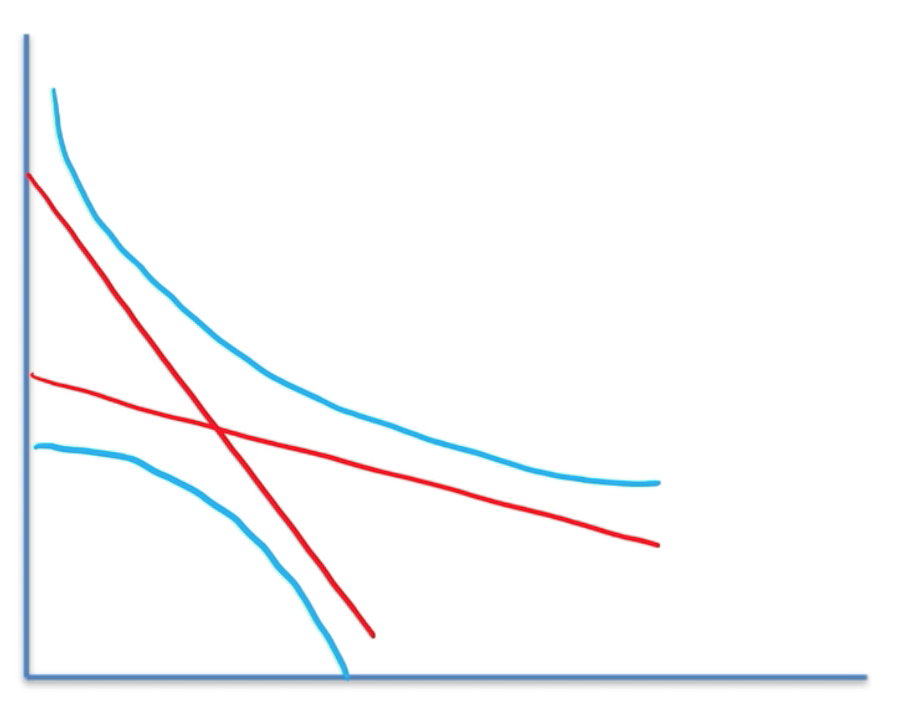
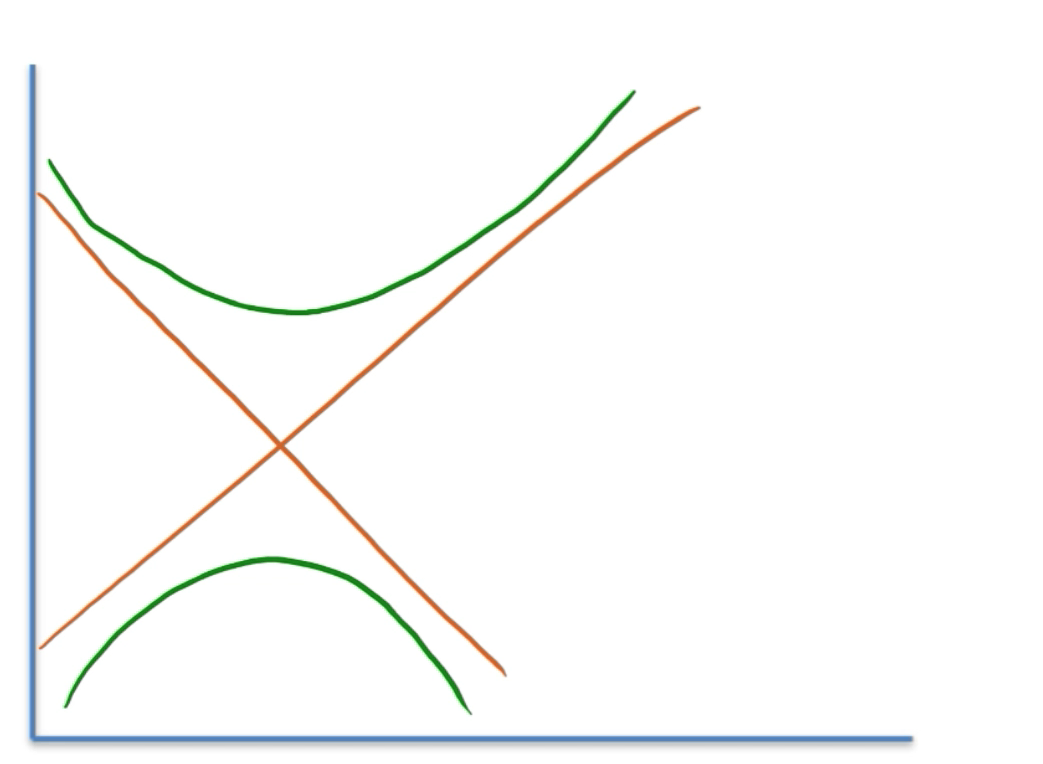
Since the confidence interval contains “0”, that means it is possible for the slope of the regression line to be zero!

  • When the slope b1=0b_1=0 , that means yy does not change when xx changes.
  • This means there is no significant (linear) relationship between XX and YY .
  • Thus, we cannot express it as a linear function.


Example #1


Confidence Interval (Slope β1\beta_1)


[20, 30]\left[20,\ 30\right]


Image illustrating Slope: The Significance of "Zero" (or Lack Thereof)


Example #2


Confidence Interval (Slope β1\beta_1)


[−16,−8]\left[-16,-8\right]


Image illustrating Slope: The Significance of "Zero" (or Lack Thereof)


Example #3


Confidence Interval (Slope β1\beta_1)


[−10, 10]\left[-10,\ 10\right]


Image illustrating Slope: The Significance of "Zero" (or Lack Thereof)


Practice: Confidence Interval for Slope with Zero

A linear regression model is used to estimate a person's net worth based on the number of cars they own. The confidence interval for the slope is [−18660,29380] \left[-18660,29380\right]\ . Which of the following is true?

Choose an answer

Create a free account to get started

Unlock full course notes by signing up

  • Video lessons taught by top educators
  • Practice questions with guided solutions
  • Written review notes for reference
  • Expert answers anytime from course tutors