Create a free account to get started

Unlock full course notes by signing up

  • Video lessons taught by top educators
  • Practice questions with guided solutions
  • Written review notes for reference
  • Expert answers anytime from course tutors

Correlation

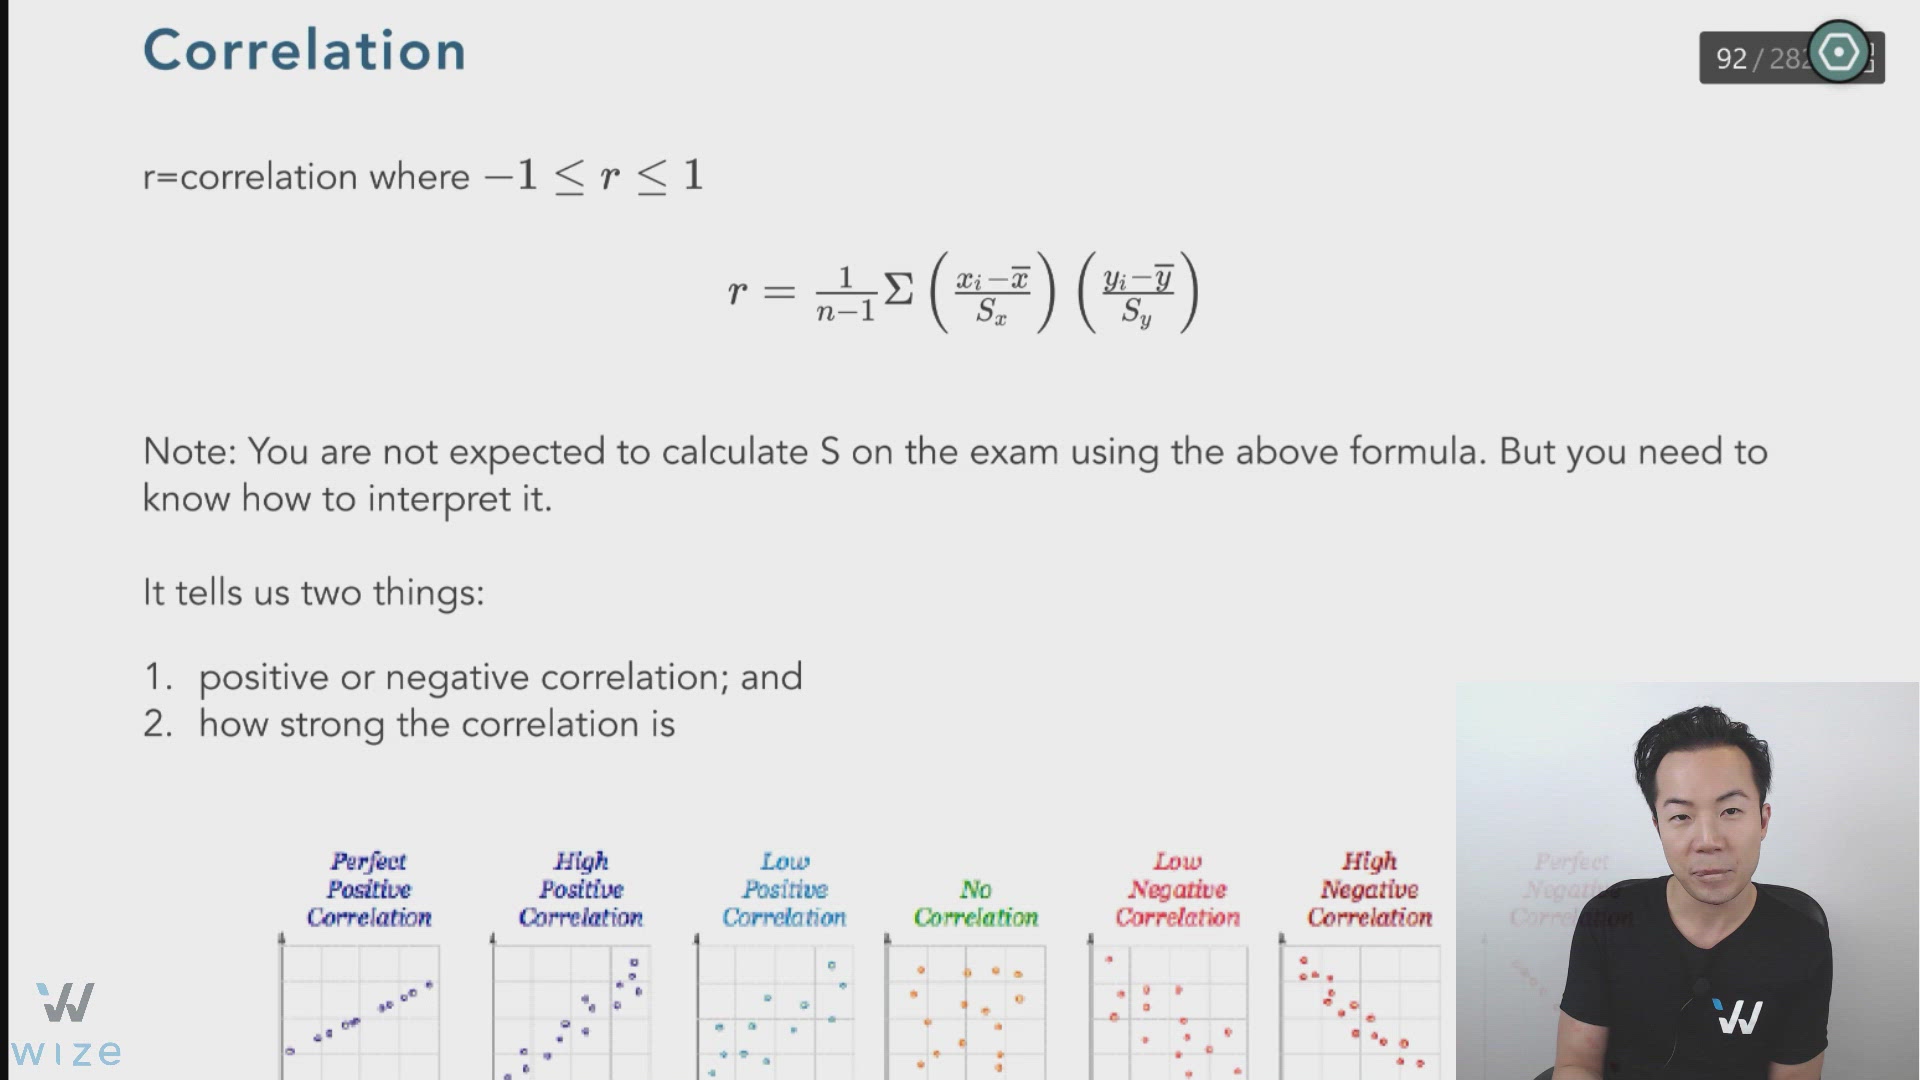
The correlation coefficient r\colorFour{r} measures the direction and strength of the linear relationship between two quantitative variables:

  1. Direction (positive, negative, neither)
  2. Strength (strong, moderate, weak, no) r=r= correlation where −1≤r≤1-1\le r\le1


r=1n−1Σ(xi−x‾Sx)(yi−y‾Sy)\displaystyle\boxed{r=\frac{1}{n-1}\Sigma\left(\frac{x_i-\overline{x}}{S_x}\right)\left(\frac{y_i-\overline{y}}{S_y}\right)}


Range of Correlation Values

The correlation coefficient rr must be a value between −1-1 and +1+1, inclusive.

  • The closer rr is to −1-1, the stronger the negative linear relationship between XX and YY
  • The closer rr is to +1+1, the stronger the positive linear relationship between XX and YY
  • The closer rr is to 00, the weaker the linear relationship between XX and YY
  • When r=0r=0, that means there is no linear correlation.


Image illustrating Correlation


Credit: https://www.mathsisfun.com/data/correlation.html


Characteristics of Correlation

  1. We can only correlate quantitative data.
  2. If you switch X and Y, the correlation value does not change.
  3. Correlation coefficient has no units.
  4. Correlation is based on linear models only.
  5. Correlation does not imply causation!

Answer the following questions.


(i) Paul wants to find the correlation between iPhone models (i.e. iPhone 3, 4, 5, 6, 7, 8, X, etc.) and battery life. What is wrong here?

Choose an answer

Create a free account to get started

Unlock full course notes by signing up

  • Video lessons taught by top educators
  • Practice questions with guided solutions
  • Written review notes for reference
  • Expert answers anytime from course tutors

Extra Practice