Create a free account to get started

Unlock full course notes by signing up

  • Video lessons taught by top educators
  • Practice questions with guided solutions
  • Written review notes for reference
  • Expert answers anytime from course tutors

Finding the Phase Constant


It is sometimes tricky to find the phase constant of an oscillation. There are many different ways to find the phase constant. Here we will see how we can use the information given to us in a problem to find the phase constant.


As a reference, let's consider the following formulas for displacement, velocity and acceleration of an oscillator:


x(t)=Acos⁡(ωt+φ)v(t)=−Aωsin⁡(ωt+φ)a(t)=−Aω2cos⁡(ωt+φ)\begin{array}{c}x\left(t\right)=A\cos\left(\omega t+\varphi\right)\\\\v\left(t\right)=-A\omega\sin\left(\omega t+\varphi\right) \\\\a\left(t\right)=-A\omega^2\cos\left(\omega t+\varphi\right) \end{array}


To understand above recipe let's look at three different situations. But before that we need a quick review of trigonometric circle (unit circle):


Quick Review of Trigonometry

In the unit circle, sin⁡θ=y\sin\theta=y and cos⁡θ=x\cos\theta=x


Image illustrating Finding the Phase Constant

Image illustrating Finding the Phase Constant


• Quadrant 1: All trig ratios are positive• Quadrant 2: Only sin ratio is positive• Quadrant 3: Only tan ratio is positive• Quadrant 4: Only cos ratio is positive\begin{array}{l} •\ \text{Quadrant 1: All trig ratios are positive}\\\\ •\ \text{Quadrant 2: Only sin ratio is positive}\\\\ •\ \text{Quadrant 3: Only tan ratio is positive}\\\\ •\ \text{Quadrant 4: Only cos ratio is positive} \end{array}


Finding the Phase Constant from x(t)\colorOne{x(t)}graph

Example:


Finding the Phase Constant from v(t)\colorOne{v(t)}graph

Example:


Finding the Phase Constant from a(t)\colorOne{a(t)}graph

Example:


Create a free account to get started

Unlock full course notes by signing up

  • Video lessons taught by top educators
  • Practice questions with guided solutions
  • Written review notes for reference
  • Expert answers anytime from course tutors

Example: Drawing Position Graph From Velocity Graph


The velocity (cm/scm/s) vs. time (ss) of a mass-spring on a SHM is shown in the graph.


Find the equation representing position against time, and draw that graph.


Image illustrating Example: Drawing the Position Graph


Solution:


v(t)=−Aωsin⁡(ωt+φ)v\left(t\right)=-A\omega\sin\left(\omega t+\varphi\right)

vmax⁡=Aω =0.4 cmv_{\max}=A\omega\ =0.4\ cm from the plot!


T=πT=\pi (for example from t=−16πt=-\frac{1}{6}\pi to t=56πt=\frac{5}{6}\pi)

⇒ω=2πT=2 rad/s⇒A=0.2 cm\Rightarrow\omega=\frac{2\pi}{T}=2\ rad/s\Rightarrow A=0.2\ cm


The last thing we need to find is the phase constant:

v(0)=−Aωsin⁡(ω(0)+φ)=−0.35v\left(0\right)=-A\omega\sin\left(\omega\left(0\right)+\varphi\right)=-0.35

⇒sin⁡(φ)=0.350.4=78\Rightarrow\sin\left(\varphi\right)=\frac{0.35}{0.4}=\frac{7}{8}

This gives us two possible answers (61 degrees or 119 degrees). Which is it?


To figure that out, we will look at the acceleration function:


a(t)=−Aω2cos⁡(ωt+φ)a\left(t\right)=-A\omega^2\cos\left(\omega t+\varphi\right)

⇒a(0)=−Aω2cos⁡(ω(0)+φ)\Rightarrow a\left(0\right)=-A\omega^2\cos\left(\omega\left(0\right)+\varphi\right)

→        −cos⁡(φ)<0      →     cos⁡(φ)>0\rightarrow\ \ \ \ \ \ \ \ -\cos\left(\varphi\right)<0\ \ \ \ \ \ \rightarrow\ \ \ \ \ \cos\left(\varphi\right)>0

We know the acceleration at t=0 is negative from the graph (slope of the tangent tine to v(t)v\left(t\right) at t=0t=0 is negative!)

⇒cos⁡(φ)>0\Rightarrow\cos\left(\varphi\right)>0

Only the 61 degree answer satisfies this condition.


So, we can now plot x(t)=Acos⁡(ωt+φ)=0.2cos⁡(2t+1.06)cmx\left(t\right)=A\cos\left(\omega t+\varphi\right)=\boxed{0.2\cos\left(2t+1.06\right)cm}


Note: We need to convert the 61 degrees to 1.06 radians because the "2t" is also in radians. (The 2 is in radians per second.)


The plot below is in seconds on the horizontal axis.
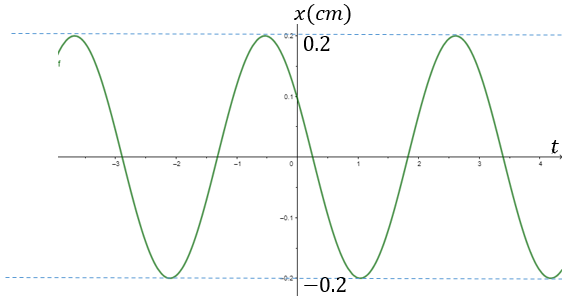

Image illustrating Example: Drawing the Position Graph


The displacement graph of a simple harmonic motion over time is shown below. Write the equation for displacement as a function of time.


Illustration for practice question: Displacement Function


Choose an answer

Create a free account to get started

Unlock full course notes by signing up

  • Video lessons taught by top educators
  • Practice questions with guided solutions
  • Written review notes for reference
  • Expert answers anytime from course tutors