Wize University Statistics Textbook > Inference about a Population Variance
Confidence Interval for Population Variance
Popular Courses
Statistics
General Course
Intro to Statistics
University Study Guides
STA 100
University of California - Davis
Intro to Statistics
University Study Guides
STATS 2035
Western University
STAT*2040
University of Guelph
STATS 2B03
McMaster University
MGTSC 212
University of Alberta
ECON 227
McGill University
STA 2391
University of Ottawa
STAT-2910
University of Windsor
Stats 8
Oregon State
STAT 1000
University of Manitoba
ENGR 371
Concordia University
STAT 252
University of Victoria
COMM 1503
Dalhousie University
ADM 2303
University of Ottawa
STAT 265
University of Alberta
STAT 202
University of Waterloo
STAT 371
University of Wisconsin - Madison

0:00 / 0:00
Confidence Interval for Population Variance
Just like using the sample mean to estimate the unknown population mean and the sample proportion to estimate the unknown population proportion , the sample variance is used to estimate the unknown population variance .
The formula for the sample variance is:
sample size
sample mean
Exam Tip
If the sample standard deviation is given on the exam, square it to find the sample variance .
The variance follows a Chi- Square distribution. The following formula is used for the test statistic:
with degrees of freedom , formally denoted as .
The above expression allows us to construct confidence intervals for the variance (provided that the population data is normally distributed). For a confidence level we get the range below:
lower critical value
upper critical value
Doing some algebra to isolate we get the confidence interval for the variance:
Wize Concept
Of course, for the confidence for the standard deviation, we just take the square-root of each side:
Since the Chi-Square Distribution is not symmetrical, the confidence interval we get will not be symmetric about the point estimate.
Confidence interval for the variance:
Let’s simplify the equation:
Wize Concept
It may seem strange that the lower confidence level uses and the upper confidence level uses , but keep in mind that these critical values are in the denominators. Dividing by a larger critical value gives you a smaller value.
If it helps, we can modify the equation as such:
0:00 / 0:00
Example: Confidence Interval for Population Variance
A sample of 7 bottles of shampoo has the following masses:
98oz, 95oz, 100oz, 88oz, 97oz, 98oz, 92oz
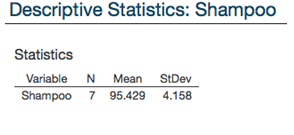
Assume the data follow a normal distribution.
(a) Construct a 95% confidence interval for the estimate of the population variance.
Degrees of freedom:
Since this is a 95% confidence interval, then , therefore
Find the critical values using the Chi-square table.
To avoid confusion, just use the larger
number as the “upper”and use the
smaller number as the “lower”.

(sample size)
(sample standard deviation)
We are 95% confident that the true population variance is between 7.2oz and 83.9oz.
(b) Construct a 95% confidence interval for the estimate of the population standard deviation.
Confidence interval for standard deviation:
We are 95% confident that the true population standard deviation is between 2.68oz and 9.16oz.
We take a random sample of 9 statistics students. The following data is based on their final grades:
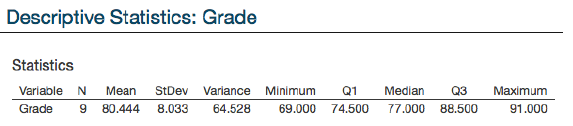
Assume the data follow a normal distribution. Click on 'Hint' to see formula and Chi-square Table.
(a) Construct a 95% confidence interval for the estimate of the population variance.
Enter the lower confidence level and upper confidence level with one decimal place (e.g. 12.6)
(b) Construct a 95% confidence interval for the estimate of the population standard deviation.
Enter the lower confidence level and upper confidence level with one decimal place (e.g. 12.6)
Example: Confidence Interval for Population Variance
Homer works in a power plant. Since his job is so important, Mr. Burns can’t afford to have Homer be late for work. He asks Smithers to monitor Homer’s punctuality. A random sample of 30 shifts reveal that Homer is late for an average of 0 minutes* with a variance of 159 minutes. Assume a normal distribution.
(*If Homer is -5 minutes late, that actually means he's 5 minutes early.)
Click on 'Hint' to see formula and Chi-square Table.
(a) Construct a 95% confidence interval for the standard deviation .
Enter the lower confidence level and upper confidence level by rounding to the nearest whole number (e.g. 10)
(b) Can Smithers infer that the standard deviation in Homer’s punctuality is greater than 5 minutes?
Enter Y for "Yes" or N for "No".