Wize University Statistics Textbook > Inference about a Population Variance
Hypothesis Test for Population Variance
Popular Courses
Statistics
General Course
Intro to Statistics
University Study Guides
STA 100
University of California - Davis
Intro to Statistics
University Study Guides
STATS 2035
Western University
STAT*2040
University of Guelph
STATS 2B03
McMaster University
MGTSC 212
University of Alberta
STA 2391
University of Ottawa
STAT-2910
University of Windsor
Stats 8
Oregon State
STAT 1000
University of Manitoba
ENGR 371
Concordia University
STAT 252
University of Victoria
COMM 1503
Dalhousie University
ADM 2303
University of Ottawa
STAT 265
University of Alberta
STAT 202
University of Waterloo
STAT 371
University of Wisconsin - Madison
STA 2100
University of Ottawa
0:00 / 0:00
Hypothesis Test for Population Variance
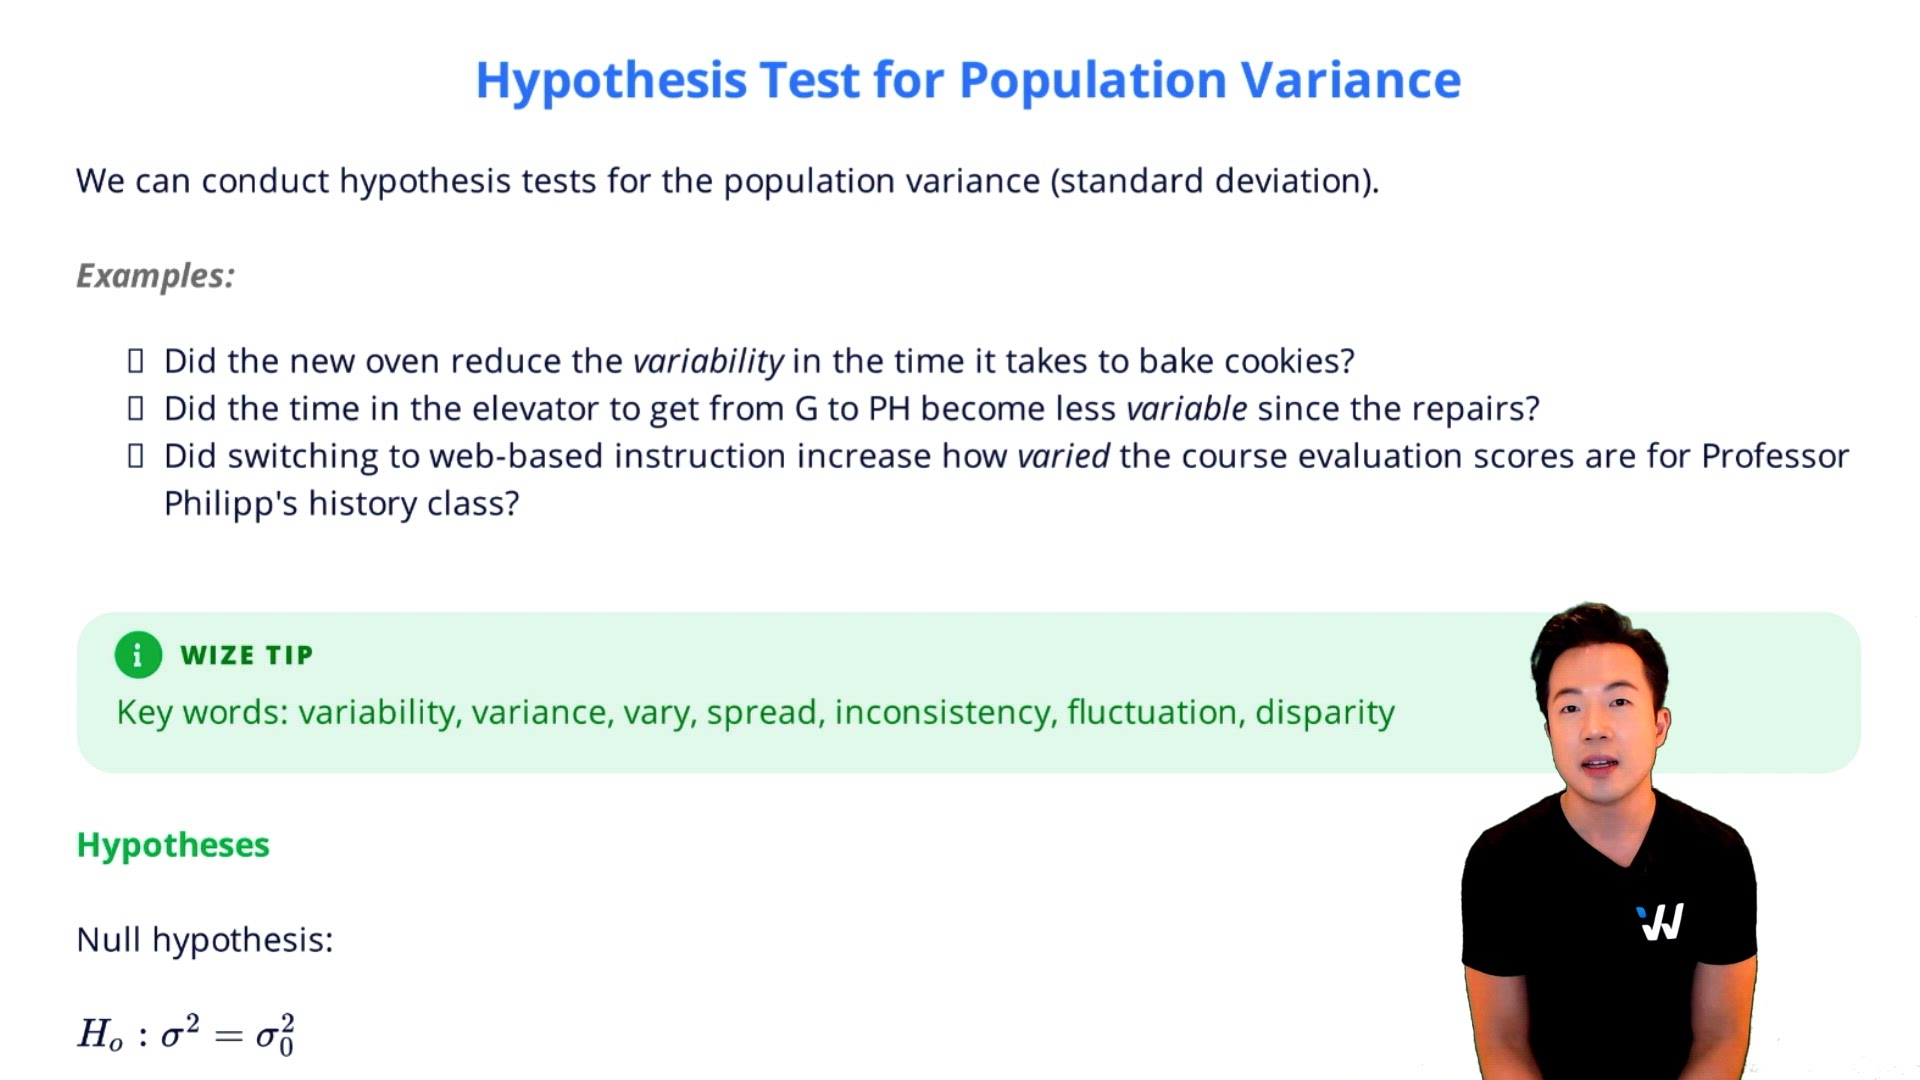
We can conduct hypothesis tests for the population variance (standard deviation).
Examples:
- Did the new oven reduce the variability in the time it takes to bake cookies?
- Did the time in the elevator to get from G to PH become less variable since the repairs?
- Did switching to web-based instruction increase how varied the course evaluation scores are for Professor Philipp's history class?
Wize Tip
Key words: variability, variance, vary, spread, inconsistency, fluctuation, disparity
Hypotheses
Null hypothesis:
Alternative hypothesis (depending on context):
("more than"; one-sided)
("less than"; one-sided)
( "not equal to", "differ", "changed"; two-sided)
Test statistic:
where:
sample size
sample variance
population variance under the null hypothesis (the "claim", status quo)
Degrees of freedom:
Test Statistic vs. Critical Value
- If is inside the critical region Reject
- If is outside the critical region Fail to reject
P-value vs. Significance Level
- If p-value Reject
- If p-value Fail to reject
Example:
If and find the p-value.
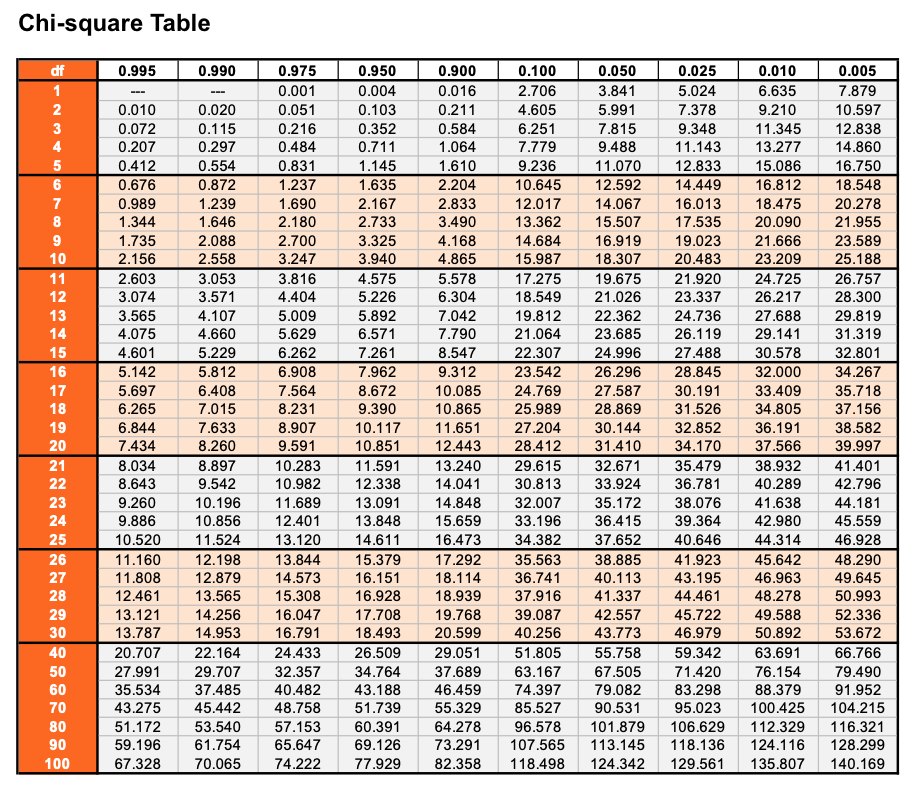
Without software, we can only find the range of the p-value using the Chi-square table:
0.025 < p-value < 0.05
Given this range of p-value, this means we can reject if the significance level is or but not if .
Exact p-value (using software):
The p-value is

0:00 / 0:00
Example: Hypothesis Test for Population Variance
Helen is the Customer Service Assistant Manager who supervises the customer service reps (CSR). Last year, the variance for the time it takes a CSR to resolve customer inquires on the phone is 9 minutes. Helen is frustrated because she believes the variation has increased since the company hired a bunch of new trainees. A random sample of 41 phone inquiries revealed a mean of 7.5 minutes with a standard deviation of 3.6 minutes.
Helen assumes the data is normally distributed.
(a) State the hypotheses.
“Variation has not increased.”
“Variation has increased.”
(b) Is the critical region on the left tail or the right tail of the Chi-square distribution?
Right tail because we are testing for "increased"
(c) Find the critical value at the 1% significance level.
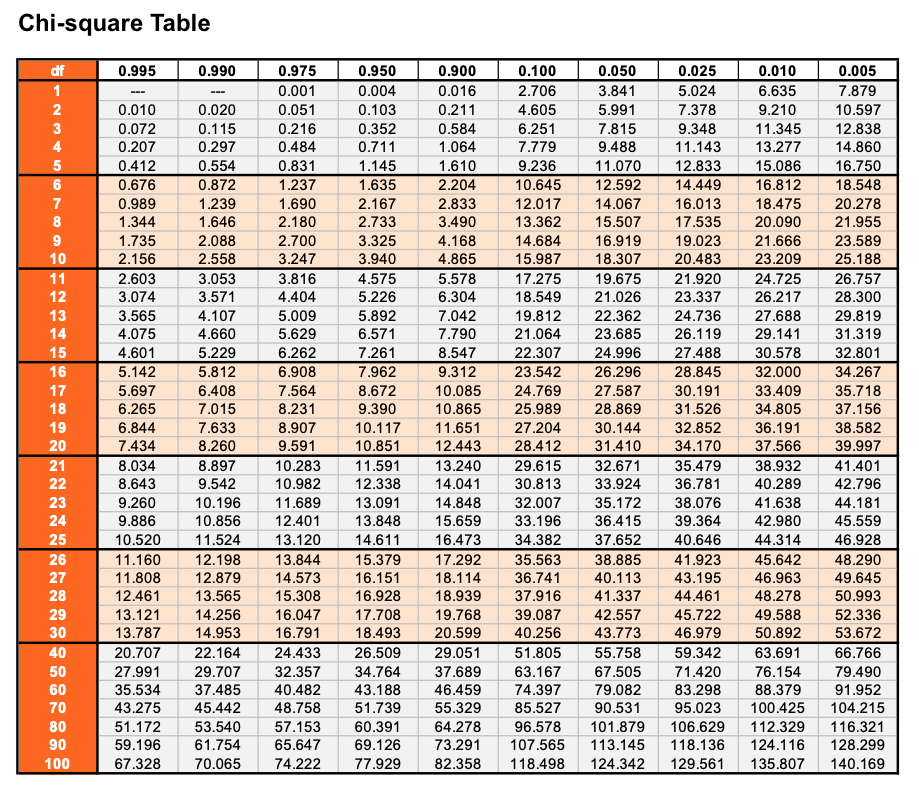
Critical value based on
Since we are testing for , the critical value is
(d) Solve for the test statistic.
(e) At the 1% significance level, is there evidence that the variance for the time it takes a CSR to resolve customer inquires?
The test statistic the critical value.
Fail to reject
There is no evidence that the variation in the time spent to solve phone inquiries has increased.
(f) At the 5% significance level, is there evidence that the variance for the time it takes a CSR to resolve customer inquires?
The test statistic the critical value.
Reject
There is evidence that the variation in the time spent to solve phone inquiries has increased.
Practice: Hypothesis Test for Population Variance
Homer works in a power plant. Since his job is so important, Mr. Burns can’t afford to have Homer be late for work. He asks Smithers to monitor Homer’s punctuality. A random sample of 30 shifts reveal that Homer is late for an average of 0 minutes* with a standard deviation of 12.6 minutes. Assume a normal distribution.
(*If Homer is -5 minutes late, that actually means he's 5 minutes early.)
Can Smithers conclude that the variance in Homer’s punctuality is greater than 100 minutes?
(a) What is the correct set of hypotheses?
Click on 'Hint' to see formula and Chi-square Table.
(a) What are the critical values?