
Multiple Regression

So far, for simple linear regression, we only used one explanatory variable to explain or predict one response variable . In reality, it may take more than one explanatory variable to explain .
Suppose we use the number of hours spent studying () to predict one’s grade () and we get this simple linear regression equation:
Given this linear regression model, . This means only 67% of grade is explained by the number of hours spent studying.
Where is the other 33%?
It is explained by other explanatory variables other than hours spent studying, such as IQ, GPA, and hours spent playing video games.
When more explanatory variables are added to a simple regression model to strengthen the ability to explain , the simple regression model is converted into a multiple regression model.
When we have multiple explanatory variables to explain y, we are using a multiple regression model:
# of explanatory variables,;
random error term. It represents everything that the model does not explain for y.
The estimated regression equation is:
To predict grade using a multiple regression line, it may look like this:
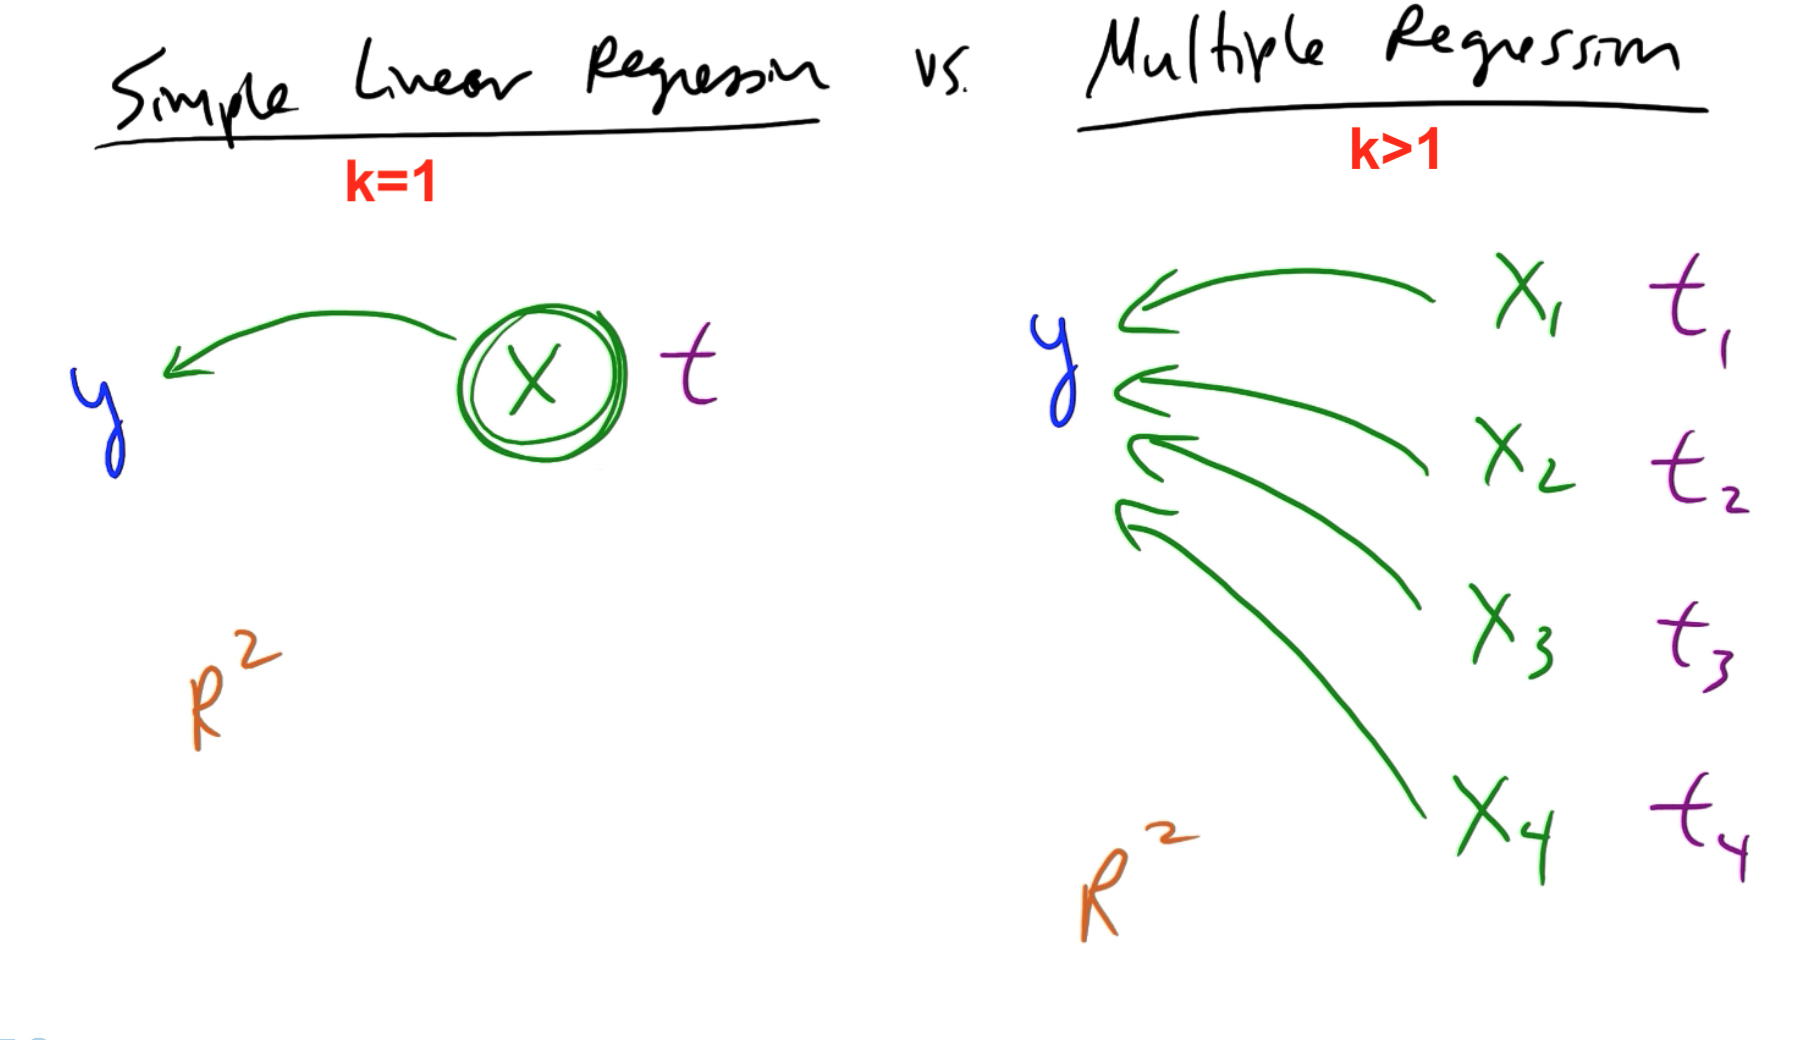
Simple Linear Regression vs. Multiple Regression
Simple Linear Regression
- : There is one explanatory variable to explain
- there is one t-score
- correlation can be used
- may be used
Multiple Regression
- : There are multiple explanatory variables to explain
- each explanatory variable has their own t-score
- correlation cannot be used
- may be used
- F-score
F-test for Multiple Regression
What the "F"?
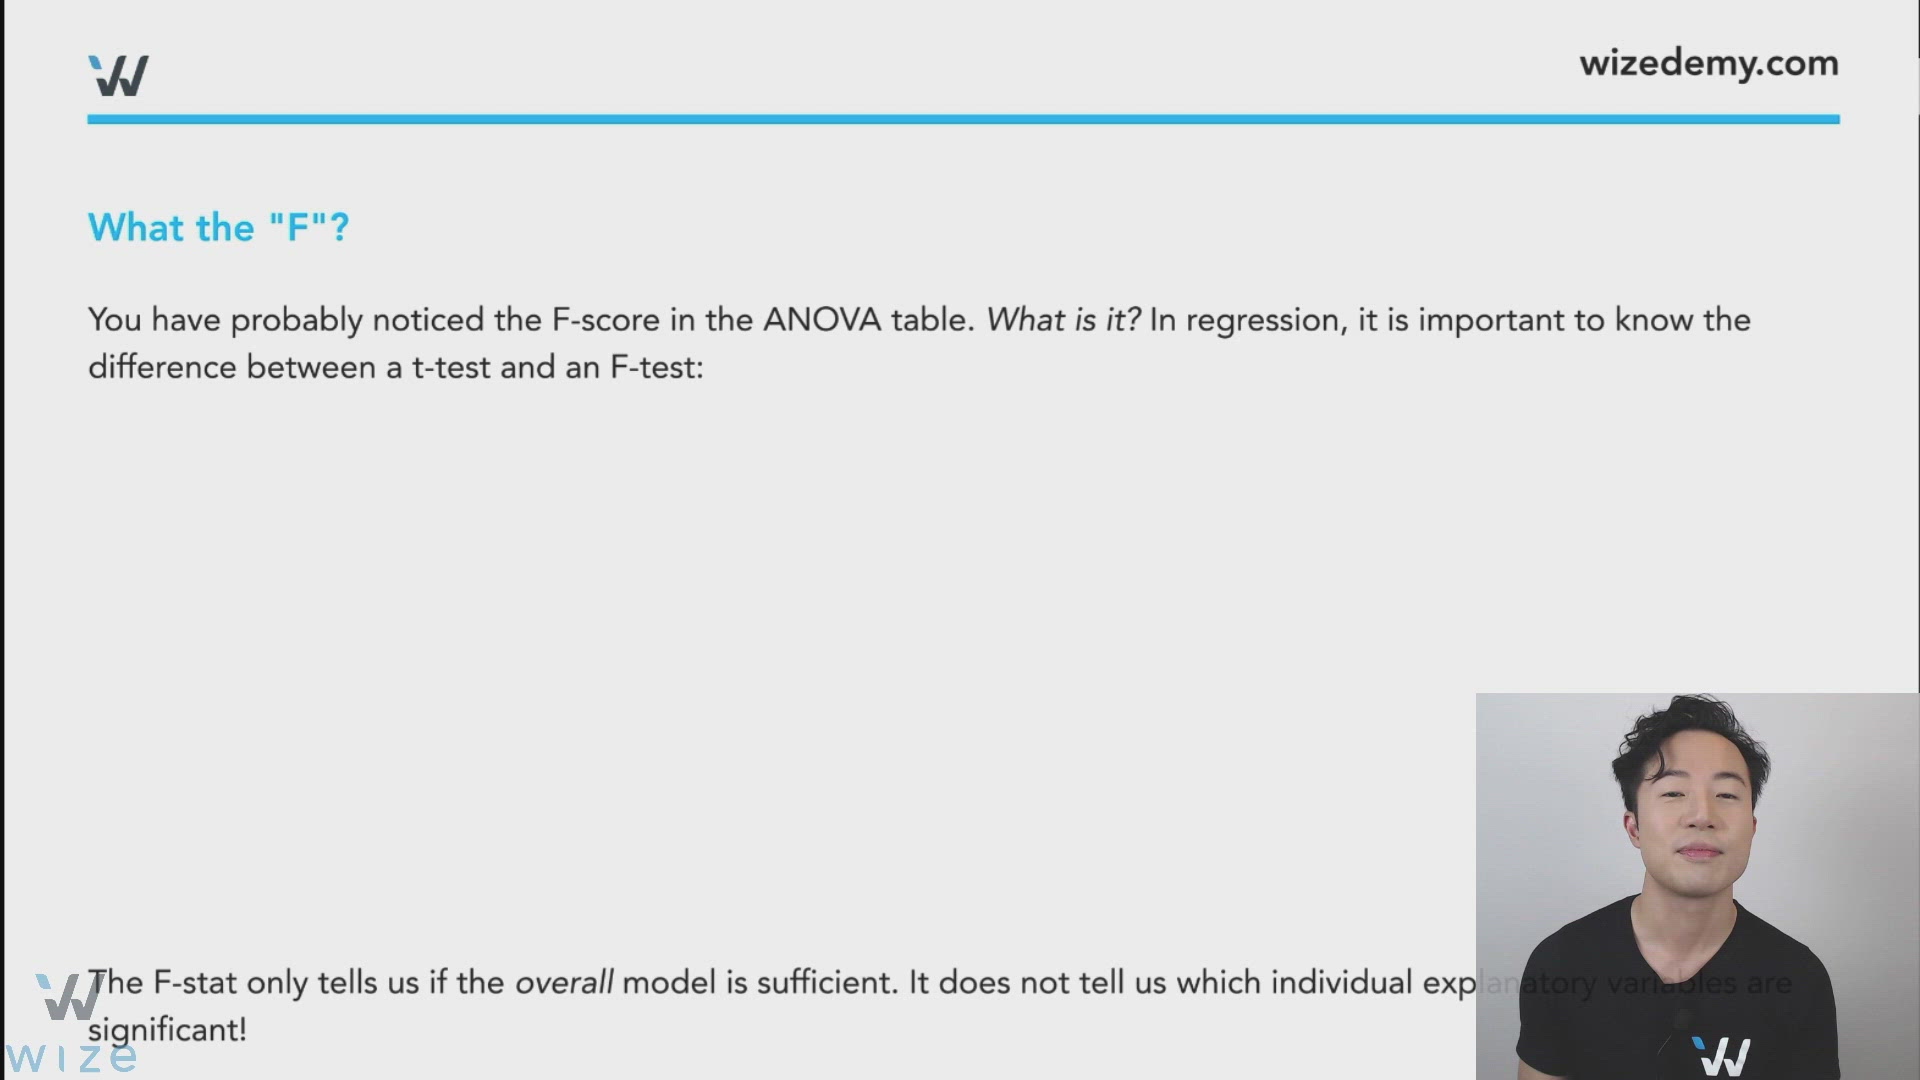
You have probably noticed the F-score in the ANOVA table. What is it? In regression, it is important to know the difference between a t-test and an F-test.
- The F-stat only tells us if the overall model is sufficient. However, it does not tell us which individual explanatory variables are significant.
- Each explanatory variable will have its own t-score so you will be able to assess the significance of each one by running t-tests.
- There is only one F-score in a regression model.

Solving for the F-score
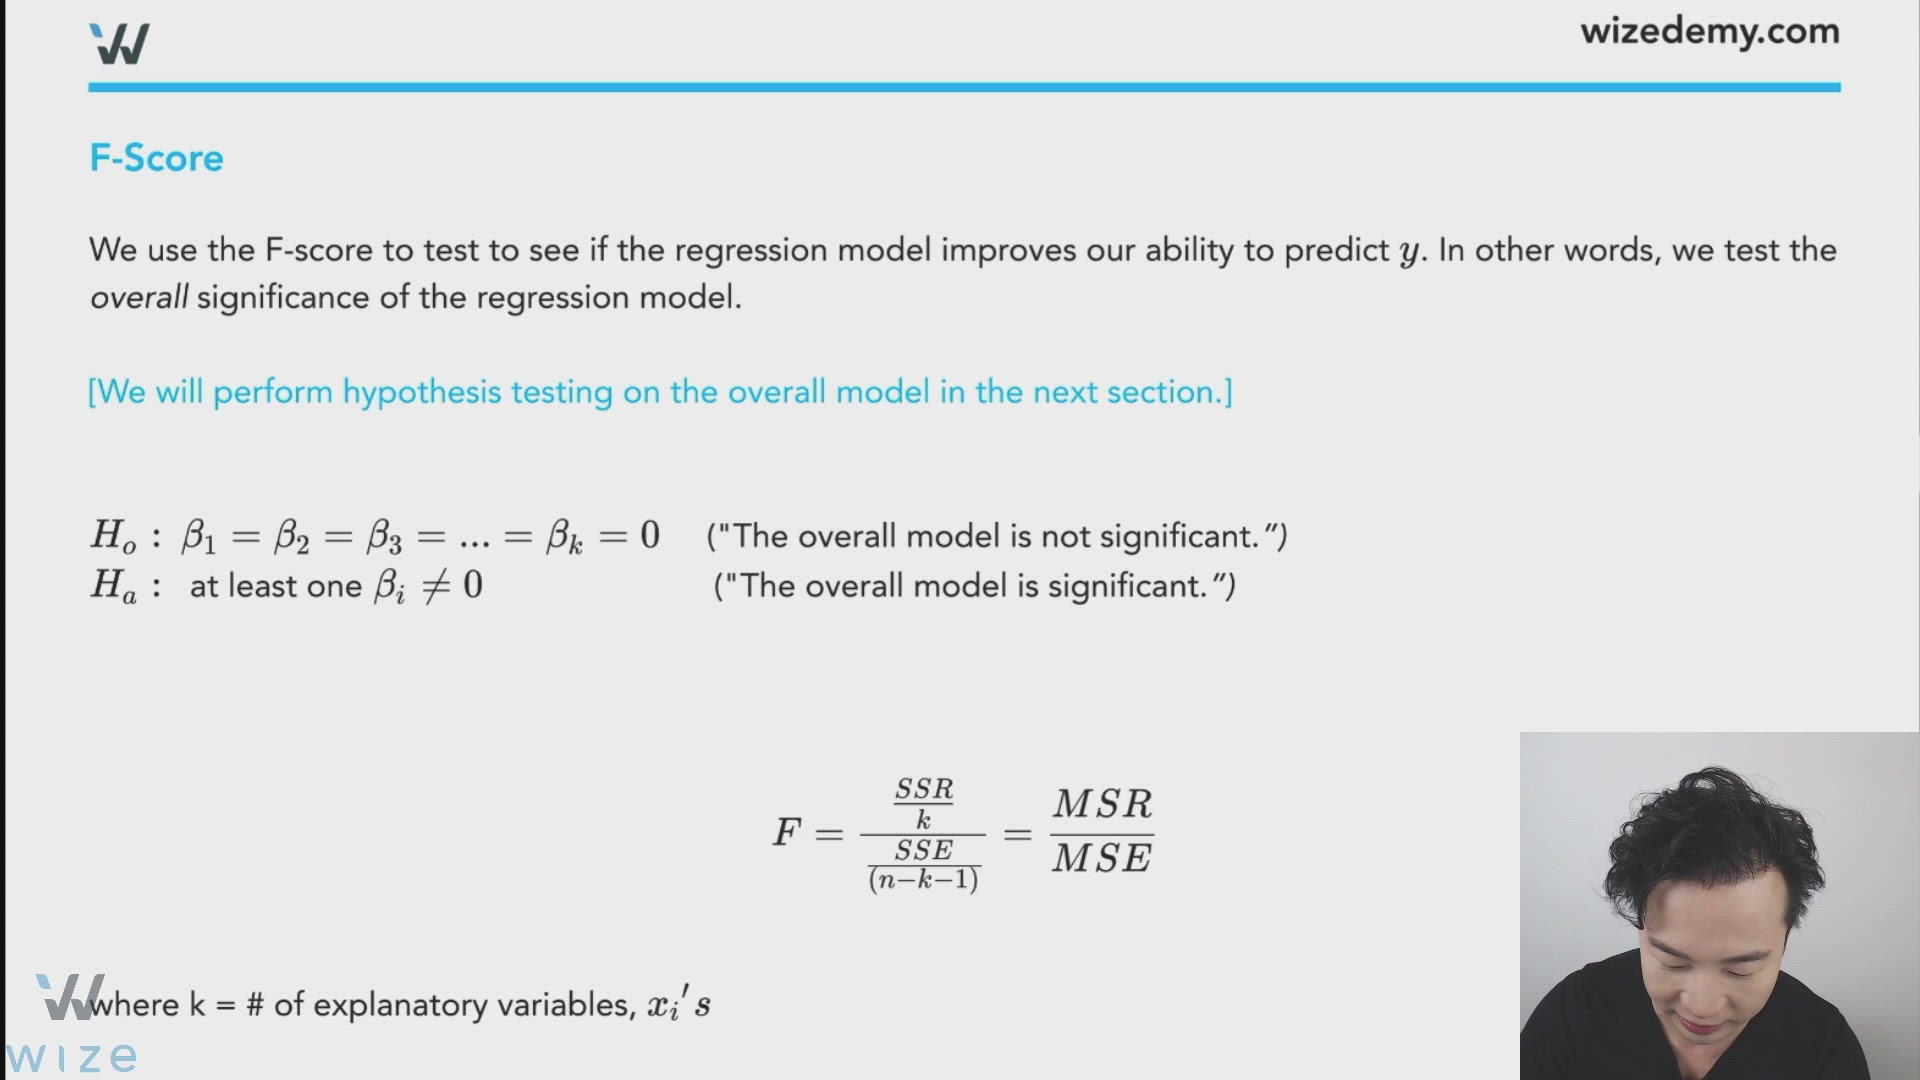
We use the F-score to test to see if the regression model improves our ability to predict . In other words, we test the overall significance of the regression model.
("The overall model is not significant.”)
at least one ("The overall model is significant.”)
"F" for "full" model
where,
- # of explanatory variables,
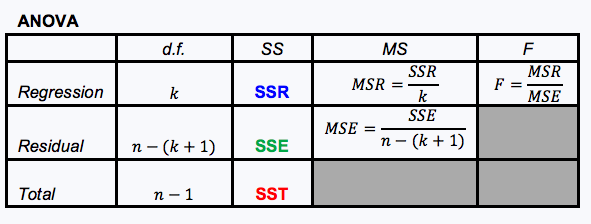
The F-test has two degrees of freedom:
- df numerator
- df denominator
Summary:
Example
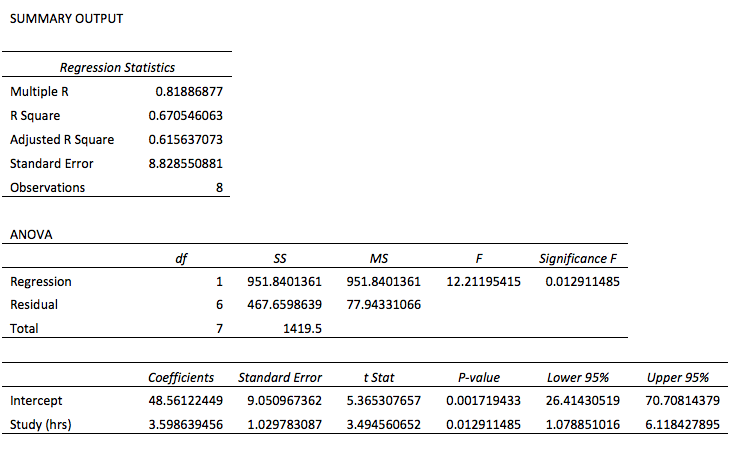
Determine the F-statistic:
The follow rules are only true in simple linear regression where is there is only one explanatory variable :
- p-value(F) = p-value(t)
0.0129 = 0.0129
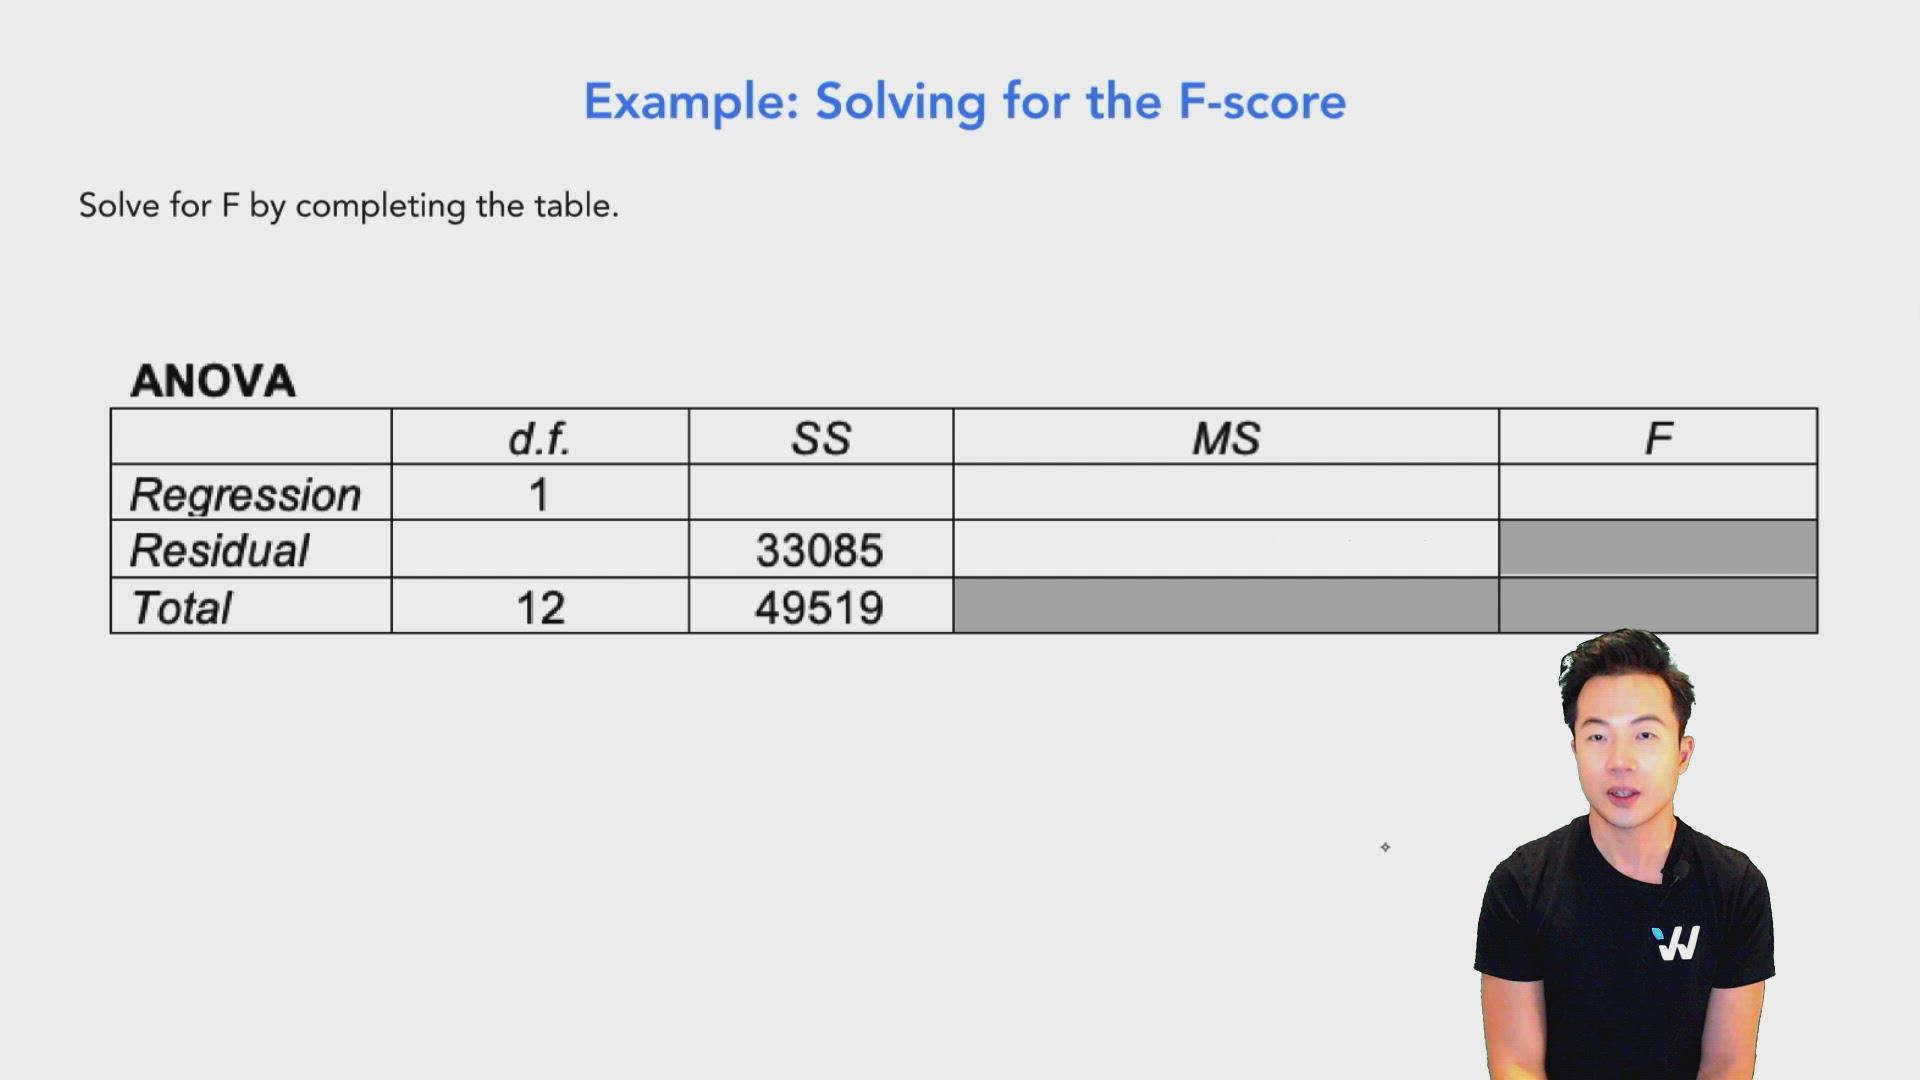
Example: Solving for the F-score
Solve for F by completing the table.

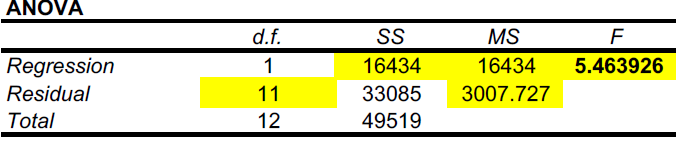
Therefore:
Don't overthink it:
(Regression df) + (Residual df) = Total
1+11 = 12