Wize AP Statistics Textbook > Calculating and Interpreting Statistics
Skewness and Symmetry
Popular Courses
Find My Course
0:00 / 0:00
Skewness and Symmetry
For quantitative data, you can plot them into a histogram and observe how they are distributed. Are the data distributed evenly or are they skewed to one direction?
Consider these three unimodal distributions:
Symmetric Distribution

Mean = Median
Examples of symmetric distributions:
- Exam grades
- Time it takes to commute to work
Left-Skewed Distribution (a.k.a. Negatively Skewed Distribution)

Mean < Median
Examples of left-skewed distributions:
- Time people spend at a concert (very few people leave early; most people stay to the end)
- Age of death (very few people die young; many people die old)
Right-Skewed Distribution (a.k.a. Positively Skewed Distribution)
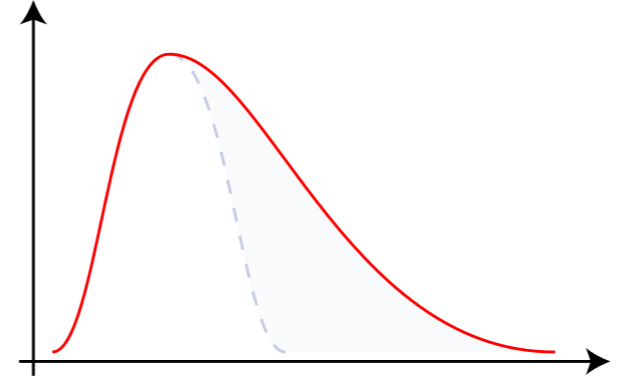
Mean > Median
Examples of right-skewed distributions:
- Number of bedrooms of homes (most homes have 1 or 2 bedrooms; few have many bedrooms)
- Salary of employees (few employees earn very high salaries, like top executives)
Practice: Skewness
For each of the following distributions, determine if it is more likely to be symmetric, skewed to the right, or skewed to the left.
(i) Number of pets in a household.