Wize AP Statistics Textbook > Hypothesis Testing for Mean and Proportion
Introduction to Hypothesis Testing
Popular Courses
Find My Course
0:00 / 0:00
Introduction to Hypothesis Testing

Hypothesis testing refers to the formal procedures to determine whether to accept or reject statistical hypotheses, each making a claim about a parameter, depending on which one our data supports.
Question Test Decision Conclusion
Examples
- Can you conclude that house prices have increased?
- Has the demand for cauliflower decreased?
- Is there evidence that life expectancy has changed?
Stating the Hypotheses
All hypothesis tests have the following:
- Ho: null hypothesis
- Ha: alternative hypothesis (or H1)
The above statements are about population parameters.
The null hypotheses always say things like: “no change”, “no effect”, “no difference”, “no, no, no…”
supports the status quo
The alternative hypotheses say things like: “there is a change”, “there is an effect”, “there is a difference”, etc.
challenges the status quo
Law Court Analogy
- The null hypothesis is the "defendant", while the alternative hypothesis is the "prosecutor".
- In order to win the case, the prosecutor has the evidential burden – in order to reject the null hypothesis, we need to observe strong evidence to support the alternative hypothesis.
- Otherwise, we have to accept (a.k.a. fail to reject) the null hypothesis’ claim.
Example
The operations manager claims that the factory workers produce an average of 150 units a day. Janice, a factory worker, believes that they produce more than that, effectively challenging that claim.
- Ho: Factory workers produce 150 units a day, on average.
- Ha: Factory workers produce more than 150 units a day, on average.
Wize Tip
- Always use parameters in the hypotheses (like or ). Never use statistics (like or ).
- The null hypothesis always has the equal = sign.
- Always use the same number in the hypotheses, specifically the number supporting the claim or status quo.
There has to be one winner: the null hypothesis (operations manager) or the alternative hypothesis (Janice). In other words, there is either sufficient evidence to support Janice or there is no evidence (or insufficient evidence) to support her.
Watch Out!
If there is no evidence to support the alternative hypothesis, it doesn’t prove that the null hypothesis is true! This just means the status quo still holds (for now).
“Innocent until proven guilty.”
Running a Hypothesis Test
How do we determine which hypothesis "wins": the null hypothesis or the alternative hypothesis?
- We run a test!
- Based on your findings, does your evidence support the alternative hypothesis?
Example
Janice selects a random sample of 30 full-time workers. The sample mean is 160 units per day, which is certainly greater than 150 units per day... but is it statistically significantly greater?
In other words, is the value 𝑥 = 160 highly unusual to observe, given that the claim is 150 units? After all, the sample mean could be this high by just chance alone.
To determine statistical significance, we need to find the test statistic. For example, a test statistic of 3.18 is more than 3 standard deviations away from the mean, so this is highly unusual, thus providing evidence to support the alternative hypothesis.

Wize Concept
Generally speaking, more than 2 standard deviations away from the mean at either direction is considered "extreme" or "highly unusual". This applies to the z-distribution and t-distribution. See: critical value.
Drawing Your Conclusion
Two scenarios:
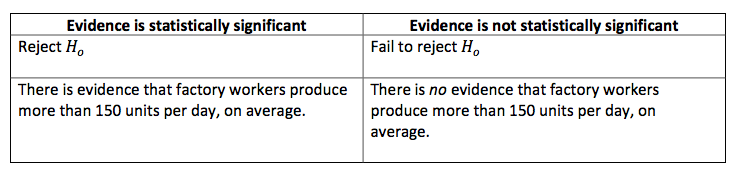
Watch Out!
Reminder: If you fail to reject the null hypothesis, it doesn’t prove that the null hypothesis is true. It just means that there is no evidence to support the alternative hypothesis.

0:00 / 0:00
Hypothesis Testing Steps
Step 1: Identify the parameter of interest
- Mean
- Proportion
Step 2: State the null and alternative hypotheses
- Ho: null hypothesis
- Ha: alternative hypothesis
The null hypothesis states the parameter of interest and what it is equal to.
The alternative hypothesis states that it must be true if the null hypothesis is false.
One-sided vs. Two-sided Tests
Is this a one-tail or two-tail test?
Write it down so you don’t forget!
One-sided test: "more than", "greater than", "less than", "fewer than", "increased", "decreased", "improved", "declined", etc.

Two-sided test: "different", "changed", "not equal to", etc.

Wize Concept
If it is a two-tail test, the p-value is doubled! See: p-value
P-value
The p-value is the probability, assuming the null hypothesis is true, of obtaining a test statistic at least as extreme as the one actually observed. Extreme means “in the direction of the alternative hypothesis.” The p-value is the probability associated with the test statistic.
Watch Out!
The p-value is not the probability that the null hypothesis is true!
What does a low p-value mean?
A low p-value means that, assuming that the null hypothesis is true, there is low probability of observing an extreme or significant outcome due to chance or randomness alone.
Example
: Stella is not a biochemistry expert.
: Stella is a biochemistry expert.
Suppose we ask her to write a T/F biochemistry exam. Assuming is true (that she is not a biochemistry expert), then we expect her to guess for the entire exam and get roughly 50% of the questions correct.
Let's say a hypothesis test revealed a p-value of 1%. This is what it means:
- If it’s true that she is not a biochemistry expert, then there’s a 1% chance she’ll ace the biochemistry exam by chance or by guessing alone.
- This is obviously a very unlikely and extreme outcome! If this outcome actually occurs, it provides evidence to support and we question the validity of .
- In other words, if she aced the exam, it's not very probable that she aced it by simply guessing. Thus, there is evidence that she is a biochemistry expert.
Watch Out!
Important: We don’t know which hypothesis is in fact true – hypothesis tests do not determine that! We do not know if Stella is truly a biochemistry expert or not, but a low p-value provides evidence to support , that she is a biochemistry expert.
When p-value low, reject !
Wize Tip
The stronger the evidence for the alternative hypothesis, the larger the test statistic, then the smaller the p-value, and the better your data supports so you can reject .
Guideline for p-values:

Step 3: Make sure all the conditions are met for the study
- Is the sample in the study randomly sampled? (See: Statistical Sampling)
- Is the sample size large enough? (See: Central Limit Theorem)
- Is the sample unbiased? (See: Sampling Bias)
Assumptions:
Individuals are independent
Population is Normal. (If not, then the sample size needs to be large.)
Step 4: Note the significance level and Critical Values
e.g , one-tailed test (right side)
The numbers at the bottom of each distribution are the critical values, and they draw the line between significant and not significant.

Wize Concept
The smaller the significance level, the stronger your evidence needs to be to reject the null hypothesis.
Exam Tip
Sometimes the significance level is not given on the exam. That’s fine – we can still see how strong our evidence is based on the size of the p-value.
Portions of information contained in this publication/book are printed with permission of Minitab, LLC. All such material remains the exclusive property and copyright of Minitab, LLC. All rights reserved.
Step 5: Calculate the test statistic and p-value
Test statistic: use the correct formula (mean vs. proportion) to find the test statistic.
Hypothesis testing for a mean
(if is known)
(if is unknown)
Hypothesis testing for a proportion
The test statistic (t-stat or z-stat) lets you do either of the two things:
- Compare the test statistic with the critical value (or )
- Find the p-value and compare it with
Step 6: Make your decision
Scenario #1
- Is the p-value smaller than
- Is the absolute value of the test statistic greater than

Portions of information contained in this publication/book are printed with permission of Minitab, LLC. All such material remains the exclusive property and copyright of Minitab, LLC. All rights reserved.
Scenario #2
- Is the p-value larger than
- Is the absolute value of the test statistic less than

Portions of information contained in this publication/book are printed with permission of Minitab, LLC. All such material remains the exclusive property and copyright of Minitab, LLC. All rights reserved.
Step 7: Draw your conclusion
Do you have evidence for the alternative hypothesis? No need to be creative with your answer. Simply restate your conclusion based on the question.
Example: “Is there evidence that profit has increased?”
Conclusion:
- If you reject : "There is evidence that profit has increased”
- If you fail to reject : "There is no evidence that profit has increased.”