Wize AP Statistics Textbook > Confidence Intervals for Mean and Proportion
Confidence Interval for a Proportion
Popular Courses
Find My Course
0:00 / 0:00
Confidence Interval for a Proportion
The population proportion is the parameter we are trying to estimate using the sample proportion , which is the statistic or estimate.
The confidence intervals used to estimate the population proportion is
where,
- is the margin of error.
The confidence level corresponds to its “multiplier” value:

Watch Out!
Remember: We only use for proportions!
Finding using the z-table:

Finding using the t-table:

0:00 / 0:00
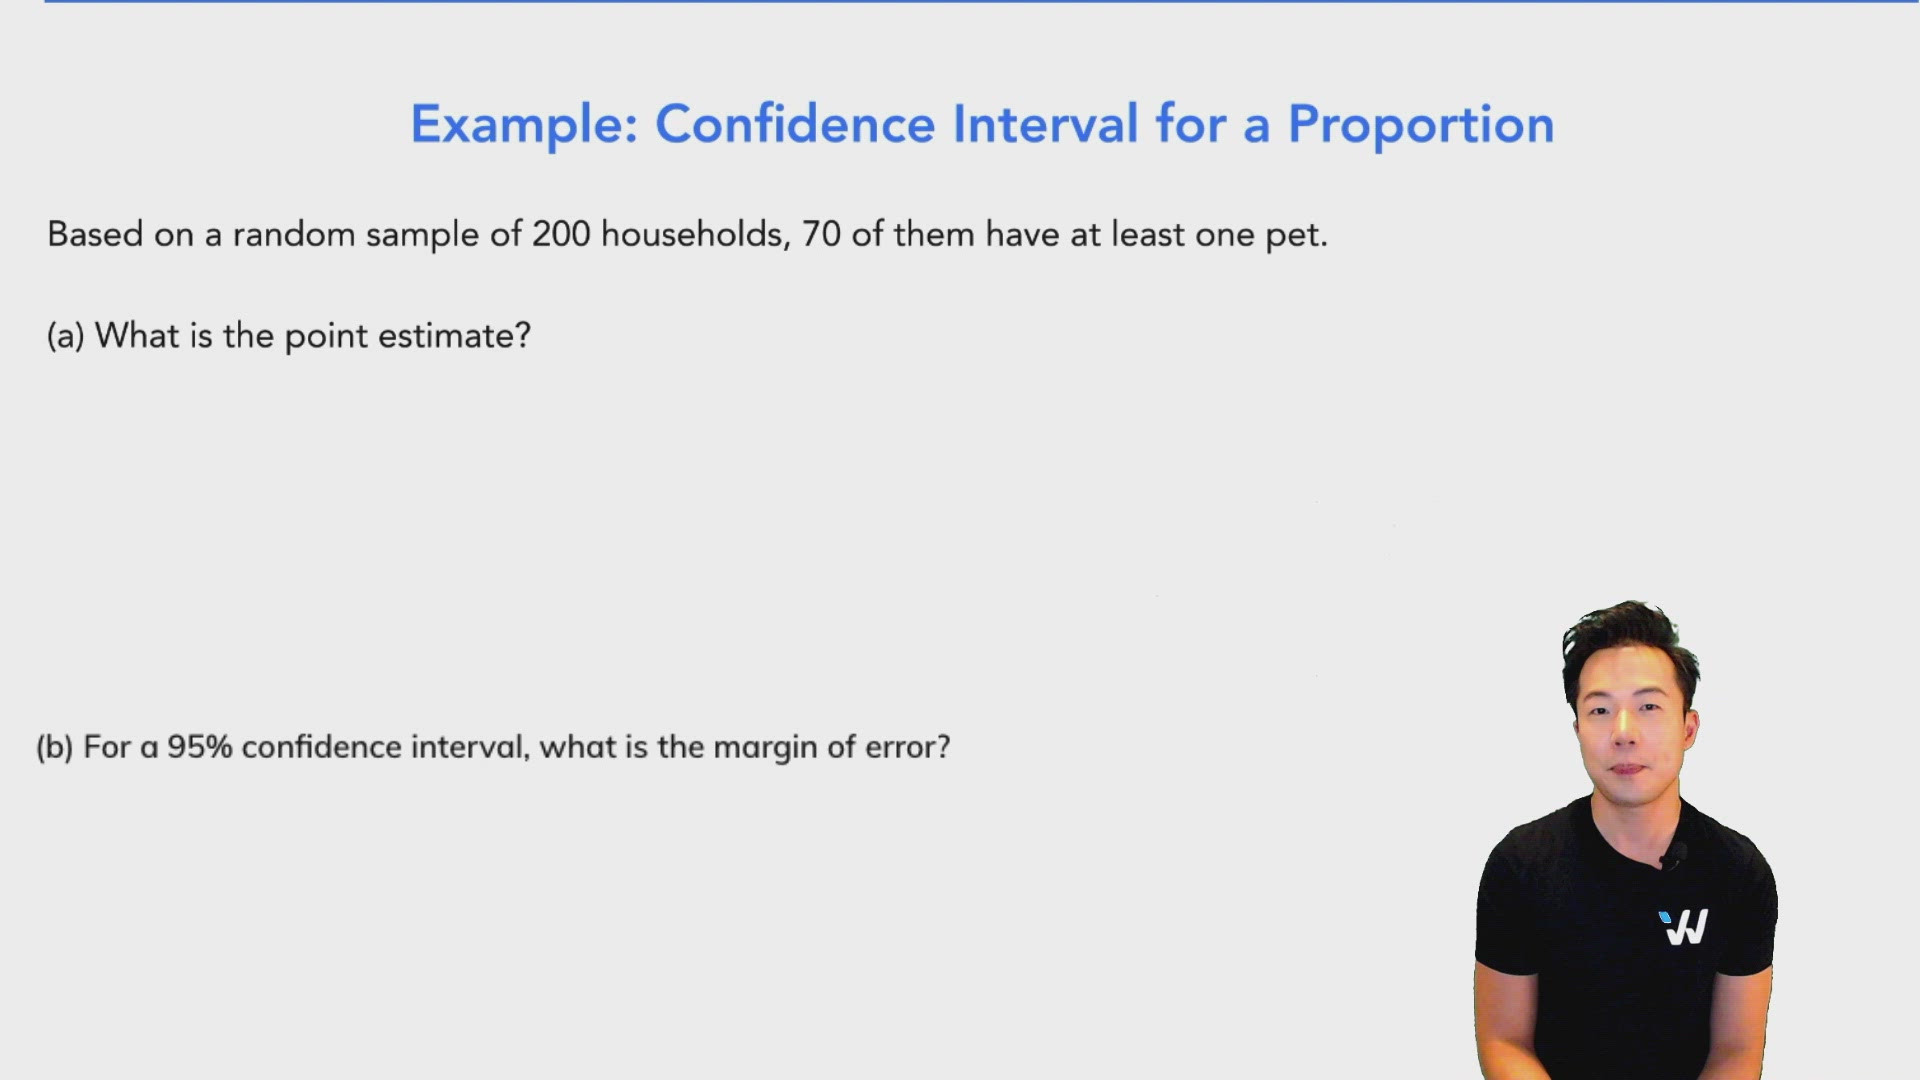
Example: Confidence Interval for a Proportion
Based on a random sample of 200 households, 70 of them have at least one pet.
(a) What is the point estimate?
The point estimate is the sample statistic. In this case, it is the sample proportion:
(b) For a 95% confidence interval, what is the margin of error?
(c) Construct a 95% confidence interval for households that has pets.
We are 95% confident that between 28.39% and 41.61% of all households have pets.
A random sample of 1000 people in Calgary were asked if they are satisfied with their mobile carriers: “YES or NO?” Results: 535 people said YES.
Construct a 95% confidence interval and interpret it in simple English.