Popular Courses
Find My Course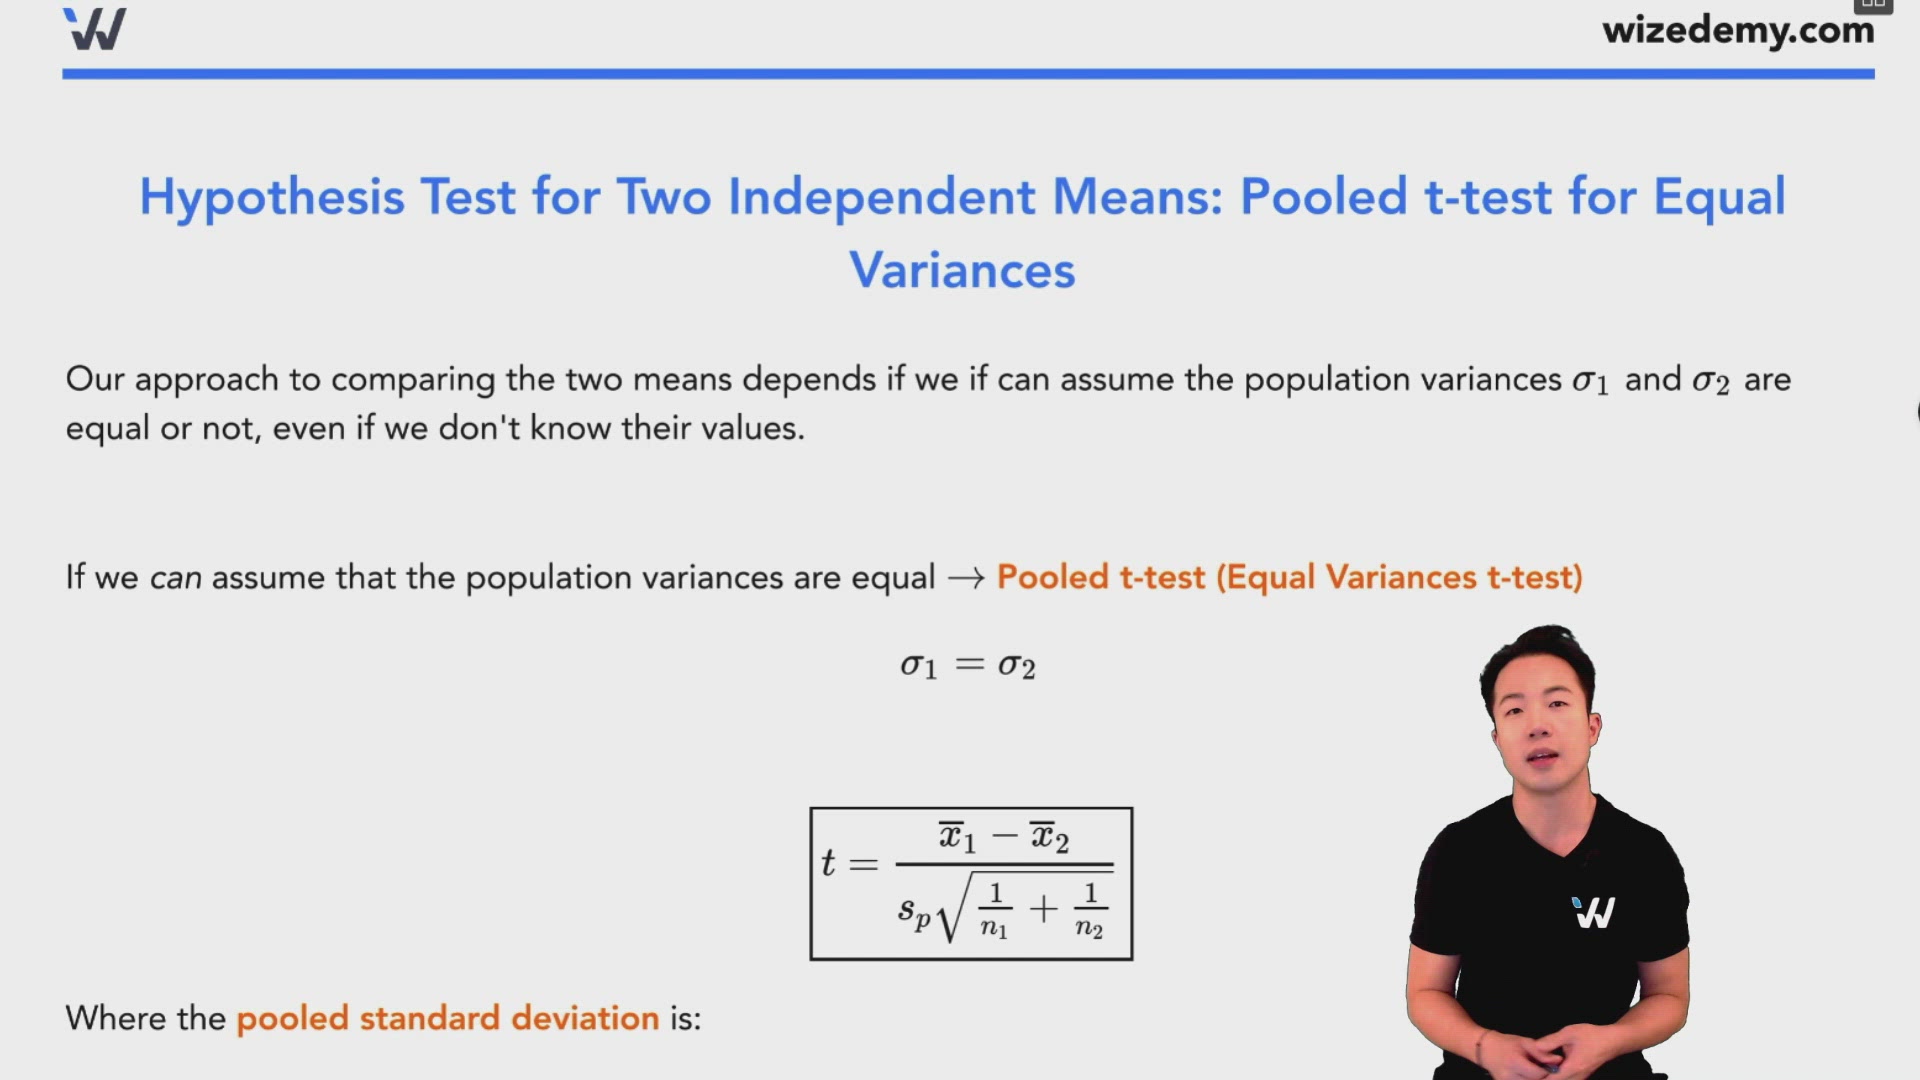
0:00 / 0:00
Hypothesis Test for Two Independent Means: Pooled t-test for Equal Variances
Our approach to comparing the two means depends if we if can assume the population variances and are equal or not, even if we don't know their values.
If we can assume that the population variances are equal Pooled t-test (Equal Variances t-test)
Where the pooled standard deviation is:
Degrees of freedom:
Wize Concept
If you cannot assume that , then it is more appropriate to run an Unpooled t-test.

0:00 / 0:00
Example: Hypothesis Test for Differences in Population Means (Pooled t-test)
A company sells educational materials that should improve reading ability in elementary school pupils. A consultant arranges for 21 grade 3 students to use the educational materials for 8 weeks. A control classroom of 23 students follows the same curriculum without the company’s educational materials.
Using the pooled/equal variances method, test the hypothesis that the mean reading scores for the treatment group is higher than that of the control group. The populations are independent and the significance level is 5%. The following shows the results of reading ability scores:
(a) State the hypotheses
Based on the keyword "higher", this is a one-sided test.
(b) Calculate the Pooled/Equal Variances test statistic and its degrees of freedom:
Plug into the formula:
Degrees of freedom:
(c) Find the range of p-values for each method. (Use the closest available provided in the table.)

Pooled variance (t=2.27, Method #1 df=42 40) *More conservative to round down the df.*
- From t-table, p-value
(d) Draw your conclusion. Are reading scores for the treatment group is higher than that of the control group?
Pooled Method
- therefore we reject .
- At the 5% level of significance, we have enough evidence to reject .
- The mean reading score of the treatment group is significantly greater than the mean reading score of the control group.
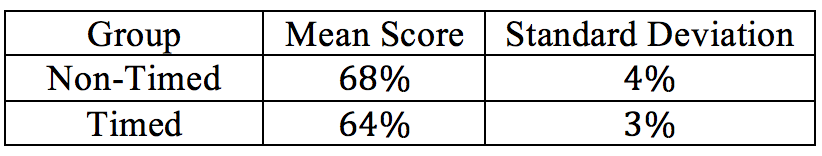
There are 10 students in Professor Bean's statistics class and 10 students in Professor Dutta's class. Professor Bean's students (Group 1) were not timed during their exam while Professor Dutta's students (Group 2) were timed. Here are the results:
Assumptions:
- Both populations are normal
- The population variances are assumed to be equal
At the 1% level of significance, we want to determine if timed tests reduce grades.
(i) State the hypotheses. (Hint: read the question carefully.)