Wize AP Statistics Textbook > Inference for Two Population Means
Confidence Interval Pooled t
Popular Courses
Find My Course
0:00 / 0:00
Confidence Interval for Two Independent Means: Pooled t (Equal Variances)
Our approach to comparing the two means depends if we if can assume the population variances and are equal or not, even if we don't know their values.
If we can assume that the population variances are equal Pooled (Equal Variances) Confidence Interval
A confidence interval for the mean difference of two independent populations with equal variances is:
where,
- is the multiplier or critical value from the t-distribution with a given degrees of freedom.
The pooled standard deviation is:
Degrees of freedom:
Wize Concept
If you are not able to assume that , then it is more appropriate to construct an Unpooled Confidence Interval,
Solving for :
Example
You want construct a 90% confidence interval and your sample sizes are and .
Use the t-table to find :


0:00 / 0:00
Example: Confidence Interval for Two Means (Pooled t)
17 students that don't have part-time jobs (Group 1) report studying on average 5 hours a day with a standard deviation of 1.40 hours. 10 other students that have part-time jobs (Group 2) report studying on average 4 hours a day with a standard deviation of 2.05 hours.
Assume both populations are normal and the population variances are equal.
(a) Compute a 95% confidence interval for the mean difference in hours of studying.
Find the degrees of freedom and then find the critical value :
Using the t-table, we get
(b) Interpret your results.
We are 95% confident that students without part-time jobs study on average between 0.37 hours less and 2.37 hours more than students that have part-time jobs.
(c) Does the confidence interval contain 0? What does that mean?
The confidence interval contains 0. There is no evidence that the means differ.
Two simple random samples were collected to compare the average spending of Blue Jay fans (Group 1) and Yankee fans (Group 2) at baseball games.
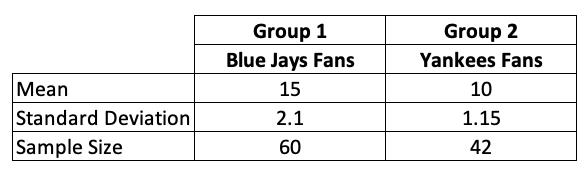
Assume that the two populations have equal variances. Construct a 95% confidence interval.
(i) What is the point estimate?