Wize AP Statistics Textbook > Probability
Tools for Probability
Popular Courses
Find My Course
0:00 / 0:00
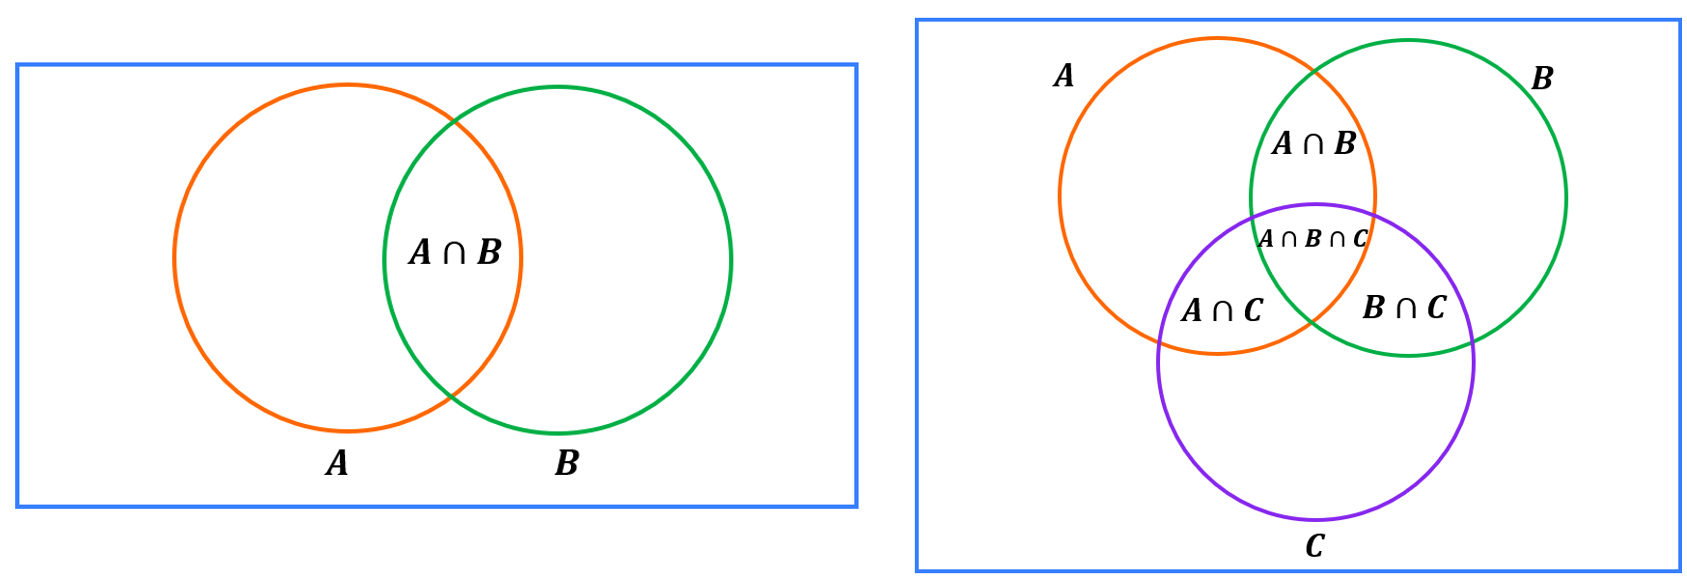
Venn Diagrams
A Venn diagram shows all the outcomes in a picture. It is particularly helpful if events overlap.
Example
You have a deck of 52 cards. What is the probability of drawing a queen or a spade?
P(queen) =
P(spade) =
P(queen and spade) =
Thus, P(queen or spade) = P(queen) + P(spade) P(queen and spade)

0:00 / 0:00
Tree Diagrams
A tree diagram shows all the outcomes as branches. It is particularly helpful if events take on several stages where the occurrence of certain events depends on which events occurred previously.
Suppose A and B are two dependent events, where Event B depends on whether Event A occurs or not. The following tree diagram shows all the possible outcomes:

Example
The faculty has 60% tenured professors and 40% junior professors.
The probability that a professor wins a teaching award, given that they are a tenured professor, is 37%:
The probability that a professor wins a teaching award, given that they are a junior professor, is 45%:
We can organize this information in a tree diagram:


0:00 / 0:00
Contingency Table (Two-way Table)
A contingency table or two-way table is great for helping you with questions that calculating probabilities involving two events A and B. The row totals and column totals always add up to 1:

Notes
Example
Event A and Event B are two events where and .

must be between
0.2
and 0.5
, inclusive. 