Create a free account to get started

Unlock full course notes by signing up

  • Video lessons taught by top educators
  • Practice questions with guided solutions
  • Written review notes for reference
  • Expert answers anytime from course tutors

Pie Chart

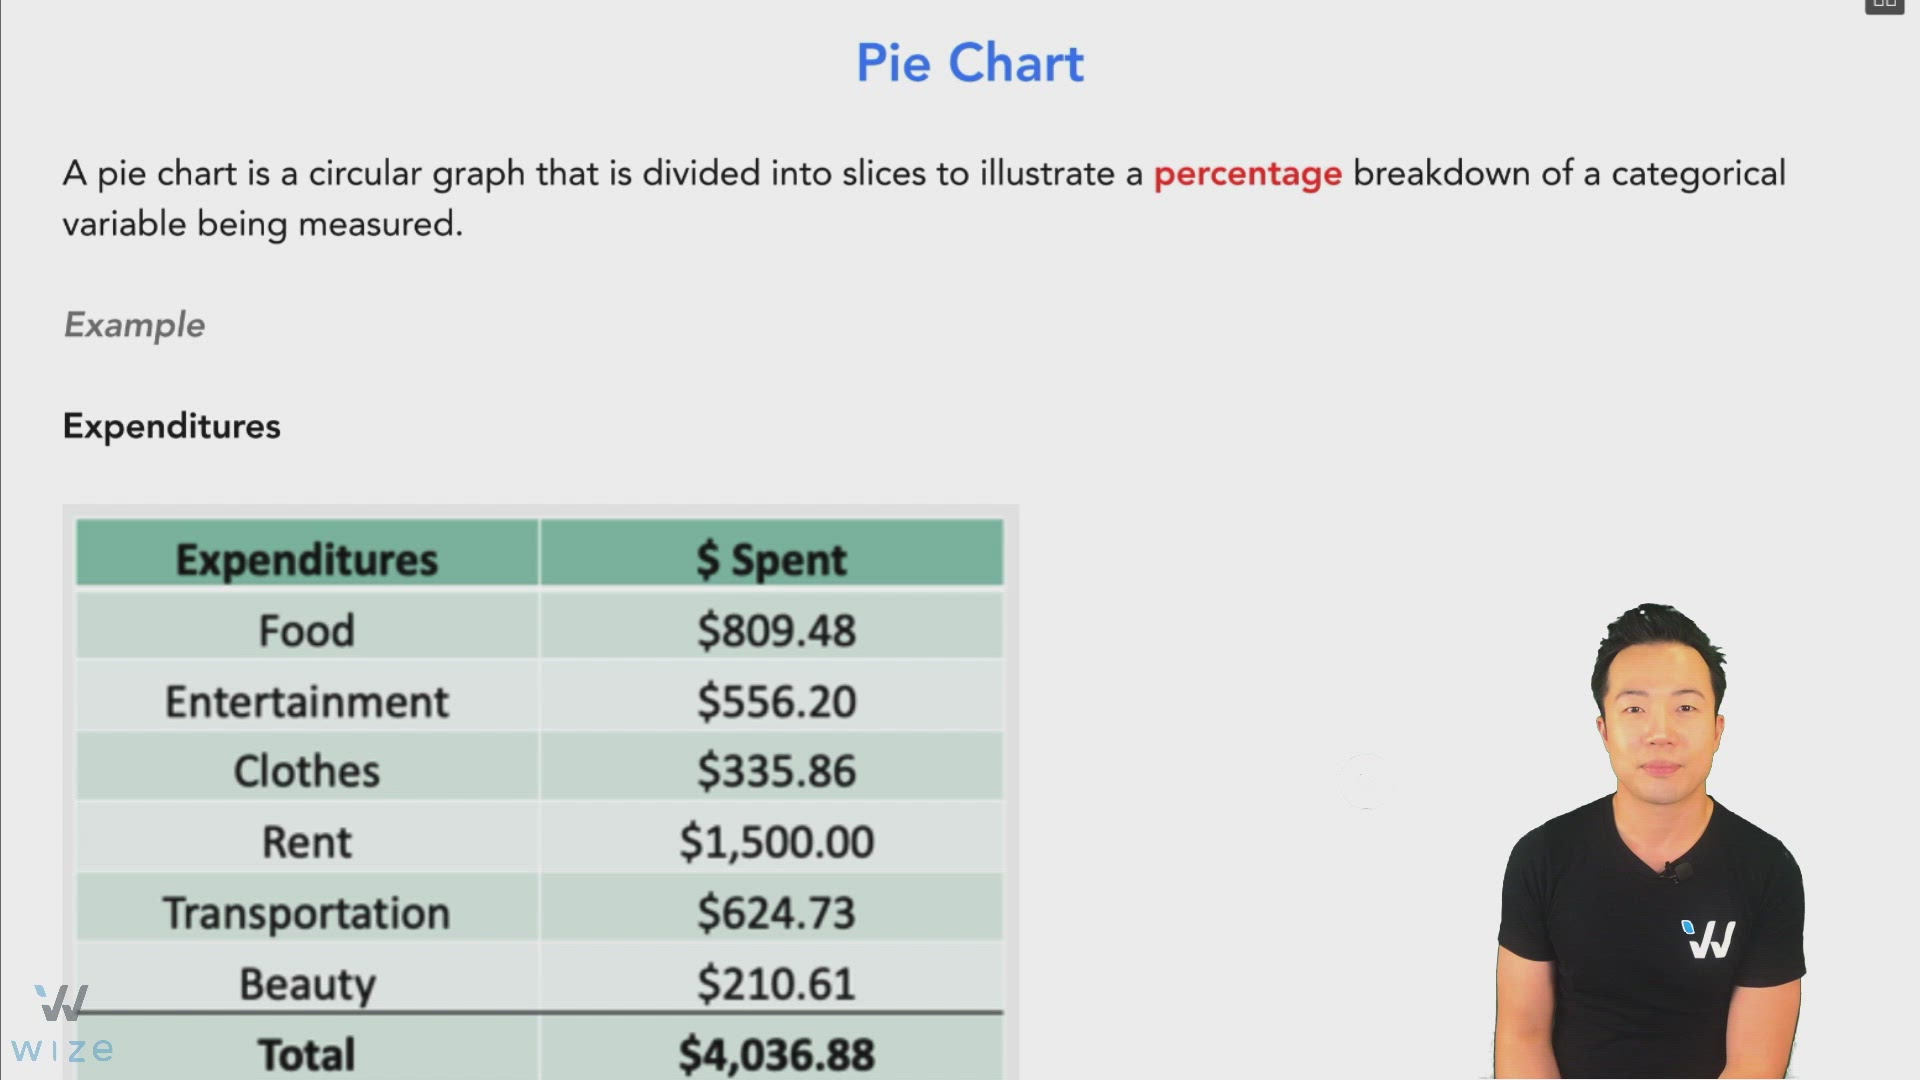
A pie chart is a circular graph that is divided into slices to illustrate a percentage breakdown of a categorical variable being measured.


Example
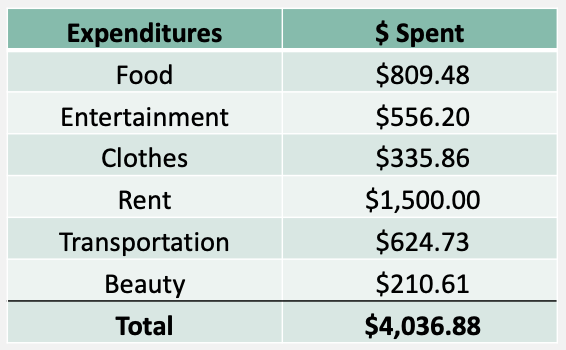

Image illustrating Pie Chart


This pie chart gives us a clear visual of this person’s expenditures.


Image illustrating Pie Chart


What is the pie chart lacking?

  • Can see % of spending for each category but can’t see how much is actually spent in $.
  • Doesn't show total $ expenditures, just 100%.

Practice: Pie Chart

What is wrong with this pie chart?


Illustration for practice question: Practice: Pie Chart

Choose an answer

Create a free account to get started

Unlock full course notes by signing up

  • Video lessons taught by top educators
  • Practice questions with guided solutions
  • Written review notes for reference
  • Expert answers anytime from course tutors