Create a free account to get started

Unlock full course notes by signing up

  • Video lessons taught by top educators
  • Practice questions with guided solutions
  • Written review notes for reference
  • Expert answers anytime from course tutors

Reciprocal Functions

Let y=f(x)y=f(x) be a continuous polynomial function. The reciprocal function of y=f(x) y=f(x)~ is:

y=1f(x)\boxed{y=\frac{1}{f(x)}}

with a vertical asymptote at f(x)=0f(x)=0 and a horizontal asymptote at y=0.y=0.


Vertical asymptotes are imaginary vertical lines that correspond to the zeros in the denominator of a reciprocal function. The function cannot touch or cross a vertical asymptote.


Horizontal asymptotes are imaginary horizontal lines that indicate the behavior of the function as x → ±∞x~\rightarrow~\pm\infin. The function can touch or cross a horizontal asymptote.


The Relationship Between y=f(x)  &  y=1f(x)\blue{y=f(x)~~\&~~y=\displaystyle\frac{1}{f(x)}}:

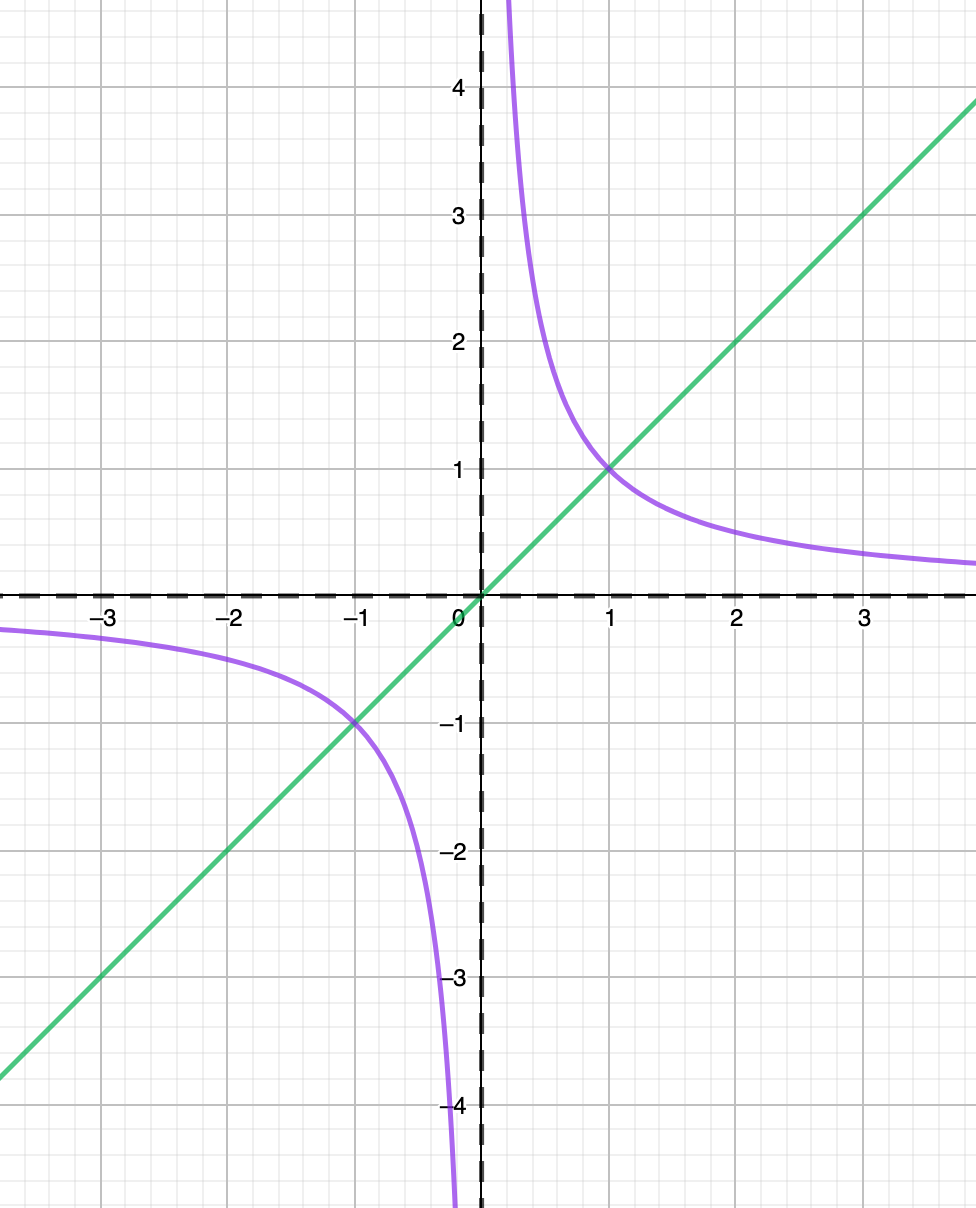
Let's look at y=x  &  y=1xy=x~~\&~~y=\displaystyle\frac{1}{x} on the same grid.


Image illustrating Reciprocal Functions xy=xy=1x−3−3−1/3−2−2−1/2−1−1−100UND111221/2331/3\begin{array}{|c|c|c|}\hline x&y=x&y=\frac{1}{x}\\\\\hline -3&-3&-1/3\\\hline -2&-2&-1/2\\\hline -1&-1&-1\\\hline 0&0&\text{UND}\\\hline 1&1&1\\\hline 2&2&1/2\\\hline 3&3&1/3\\\hline \end{array}


y=xy=1xX-Interceptsx=0NAEnd Behaviourx →∞,y →∞x →−∞,y →−∞x →∞,y →0x →−∞,y →−0Points of(1,1)(1,1)Intersection(−1,−1)(−1,−1)Increasing(−∞,∞)NADecreasingNA(−∞,0)∪(0,∞)Domain(−∞,∞)(−∞,0)∪(0,∞)Range(−∞,∞)(−∞,0)∪(0,∞)\begin{array}{|l|c|c|}\hline\\ &y=x&y=\frac{1}{x}\\ \\ \hline\\ \footnotesize\textbf{X-Intercepts}&x=0&\text{NA}\\\\\hline\\ \footnotesize\textbf{End Behaviour}&\begin{array}{c}x~\rightarrow\infin,y~\rightarrow\infin\\ x~\rightarrow-\infin,y~\rightarrow-\infin\end{array}&\begin{array}{c}x~\rightarrow\infin,y~\rightarrow0\\ x~\rightarrow-\infin,y~\rightarrow-0\end{array}\\\\\hline\\ \footnotesize\textbf{Points of}&(1,1)&(1,1)\\ \footnotesize\textbf{Intersection}&(-1,-1)&(-1,-1)\\\\\hline\\ \footnotesize\textbf{Increasing}&(-\infin,\infin)&\text{NA}\\\\\hline\\ \footnotesize\textbf{Decreasing}&\text{NA}&(-\infty,0)\cup(0,\infty)\\\\\hline\\ \footnotesize\textbf{Domain}&(-\infin,\infin)&(-\infty,0)\cup(0,\infty)\\\\\hline\\ \footnotesize\textbf{Range}&(-\infin,\infin)&(-\infty,0)\cup(0,\infty)\\\\\hline \end{array}

Create a free account to get started

Unlock full course notes by signing up

  • Video lessons taught by top educators
  • Practice questions with guided solutions
  • Written review notes for reference
  • Expert answers anytime from course tutors

Graphing Reciprocal Functions


If given y=f(x)y=f(x), the following are steps are provided to illustrate how to graph y=1f(x)y=\displaystyle\frac{1}{f(x)} :


  1. Sketch y=f(x)y=f(x), stating the domain and range.
  2. Identify the x-intercepts on y=f(x)y=f(x)
  3. Identify the points of intersection between y=f(x)y=f(x) and y=±1y=\pm1 (critical points)
  4. Turn the x-intercepts into vertical asymptotes & draw the vertical asymptotes (dotted lines)
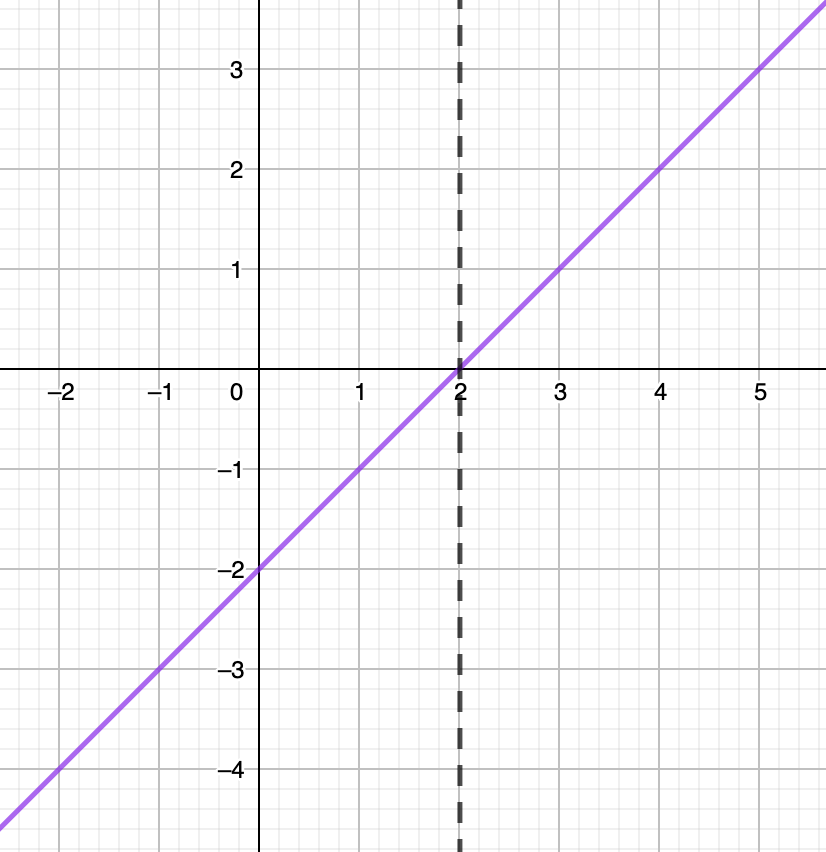
  5. Draw the horizontal asymptote (dotted lines)
  6. Start from the critical points and draw the graph towards the asymptotes.


Example 1

Graph y=1x−2y=\displaystyle\frac{1}{x-2}


Step 1.

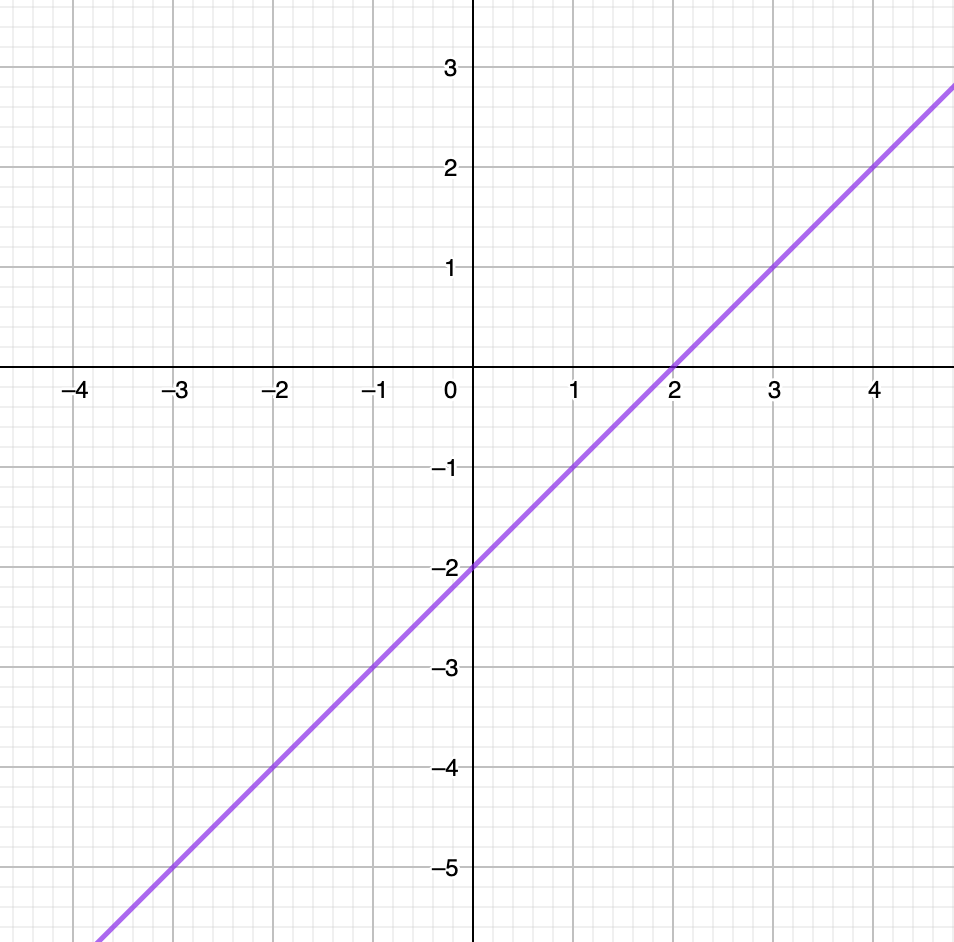
Sketch y=x−2,\green{y=x-2,}stating the domain and range


Image illustrating Graphing Reciprocal Functions xy−2−4−1−30−21−1203142\begin{array}{|c|c|}\hline x&y\\\hline -2&-4\\\hline -1&-3\\\hline 0&-2\\\hline 1&-1\\\hline 2&0\\\hline 3&1\\\hline 4&2\\\hline \end{array}


Domain: (−∞,∞)(-\infin,\infin)


Range: (−∞,∞)(-\infin,\infin)


Step 2.

Identify the x-intercepts on y=x−2\green{y=x-2}


The x-intercept is at (2,0)(2,0)


Step 3.

Identify the points of intersection between y=x−2\green{y=x-2} and y=±1\green{y=\pm1} (critical points)


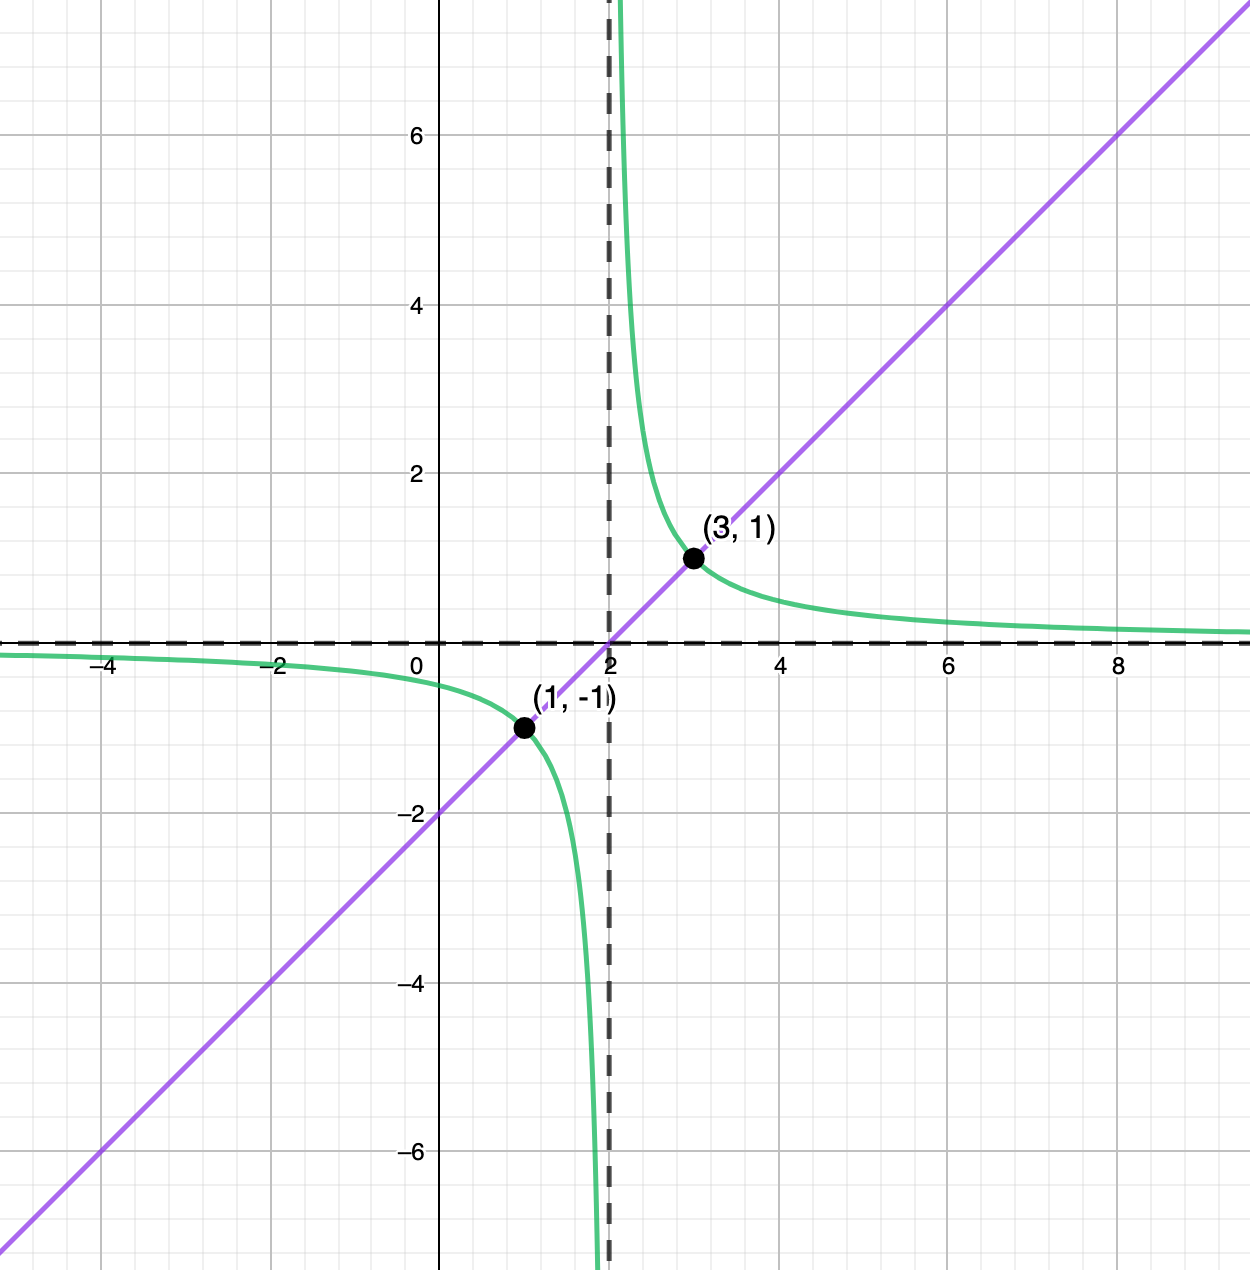
The points of intersection are (3,1)  &  (1,−1)(3, 1)~~\&~~(1, -1)


Step 4.

Turn the x-intercepts into vertical asymptotes & draw the vertical asymptotes


Image illustrating Graphing Reciprocal Functions


Step 5

Draw the horizontal asymptote
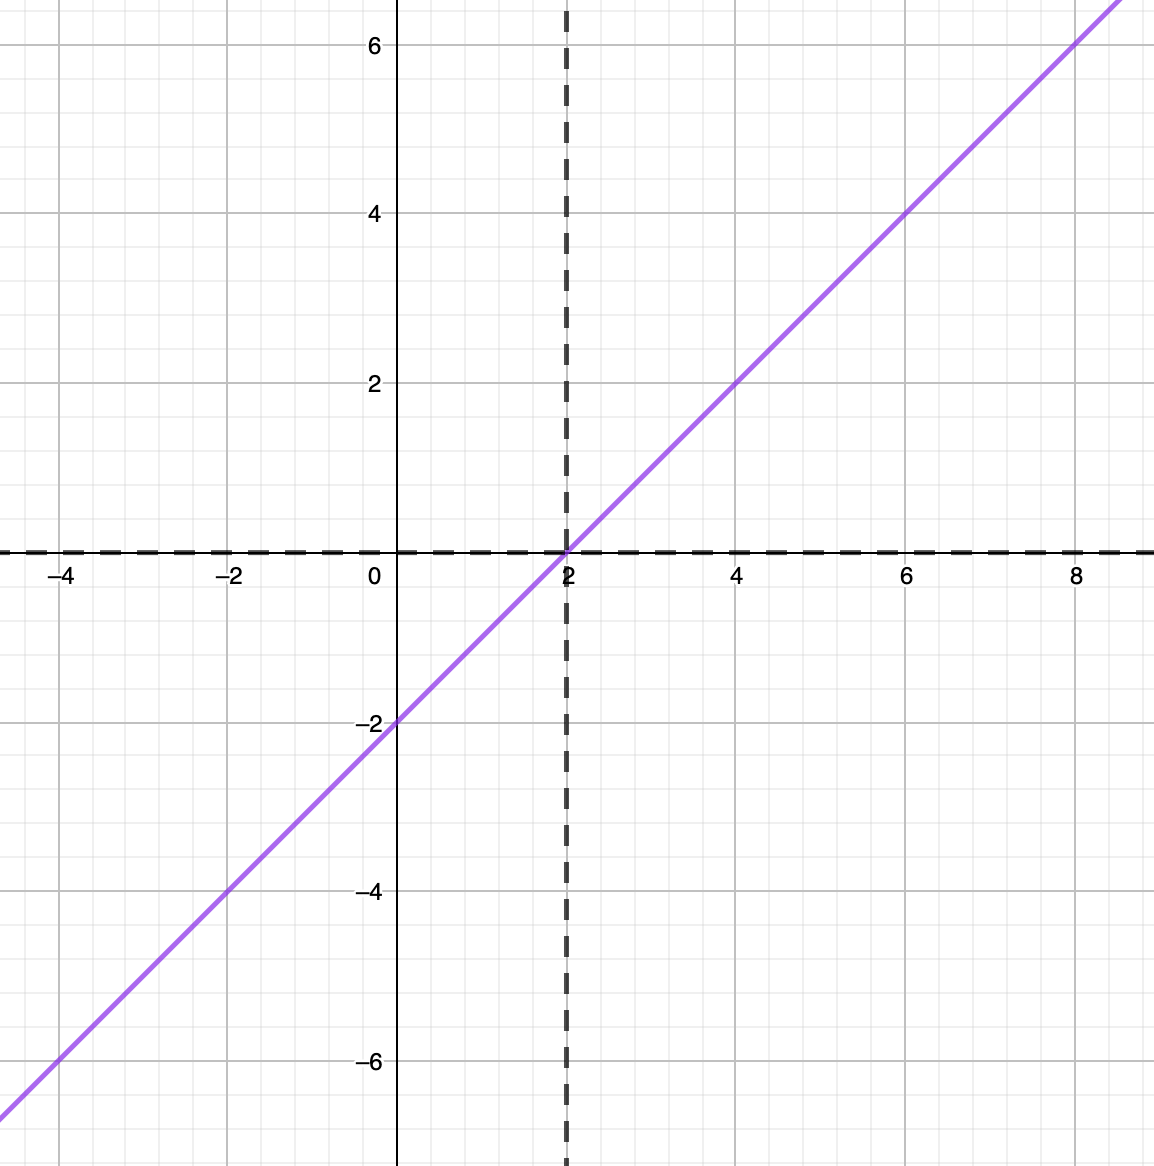

Image illustrating Graphing Reciprocal Functions


Step 6.

Start from the critical points and draw the graph towards the asymptotes.

The end behaviour of y=x−2 y=x-2~:

x→∞,y→∞x→−∞,y−→∞x\rightarrow\infin,y\rightarrow\infin\newline{} x\rightarrow-\infin,y-\rightarrow\infin


The end behaviour of y=1x−2y=\displaystyle\frac{1}{x-2} is:

x→∞,y→−0x→−∞,y→0x\rightarrow\infin,y\rightarrow-0\newline{} x\rightarrow-\infin,y\rightarrow0


Image illustrating Graphing Reciprocal Functions

Example 2


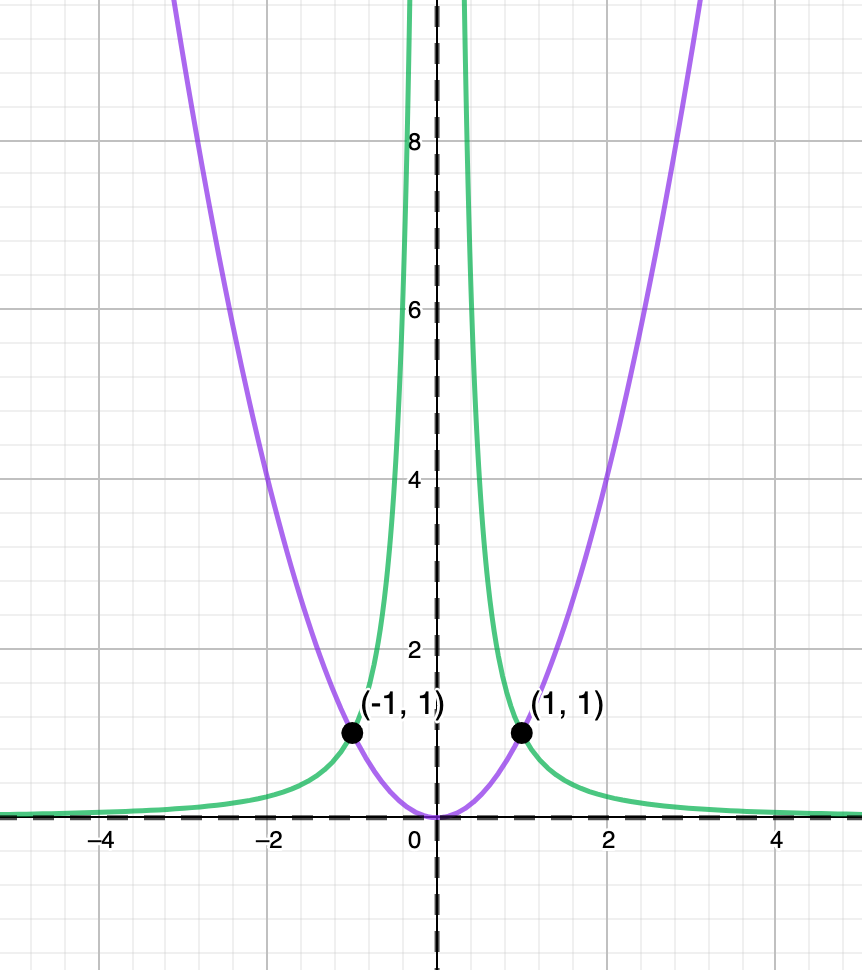
Graph y=1x2y=\displaystyle\frac{1}{x^2}


Step 1.

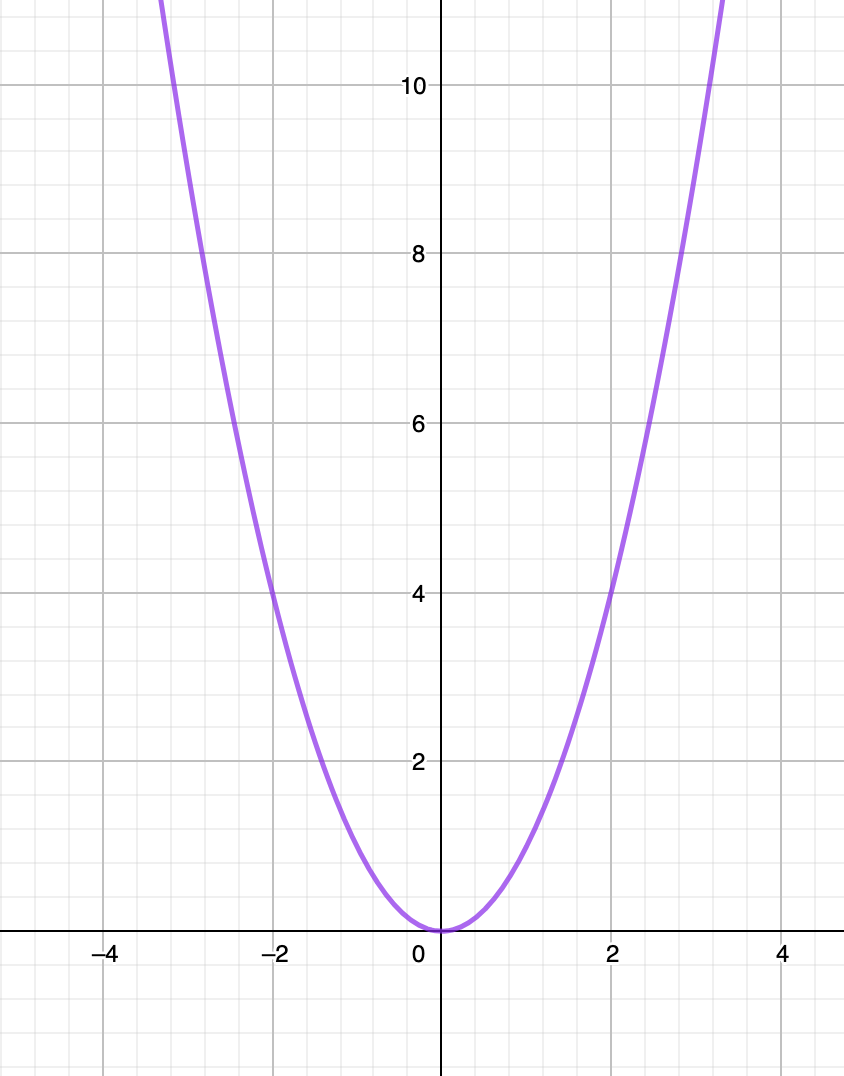
Sketch y=x2\green{y=x^2}, stating the domain and range.


Image illustrating Graphing Reciprocal Functions xy−24−11001124\begin{array}{|c|c|}\hline x&y\\\hline -2&4\\\hline -1&1\\\hline 0&0\\\hline 1&1\\\hline 2&4\\\hline \end{array}


Domain: (−∞,∞)(-\infin, \infin)


Range: [0,∞)[0,\infin)


Step 2.

Identify the x-intercepts on y=x2\green{y=x^2}


The x-intercept is at (0,0)(0,0)


Step 3.

Identify the points of intersection between y=x2\green{y=x^2} and y=±1\green{y=\pm1} (critical points)


The points of intersection are (1,1)  &  (−1,1)(1, 1)~~\&~~(-1, 1)


Step 4.

Turn the x-intercepts into vertical asymptotes & draw the vertical asymptotes
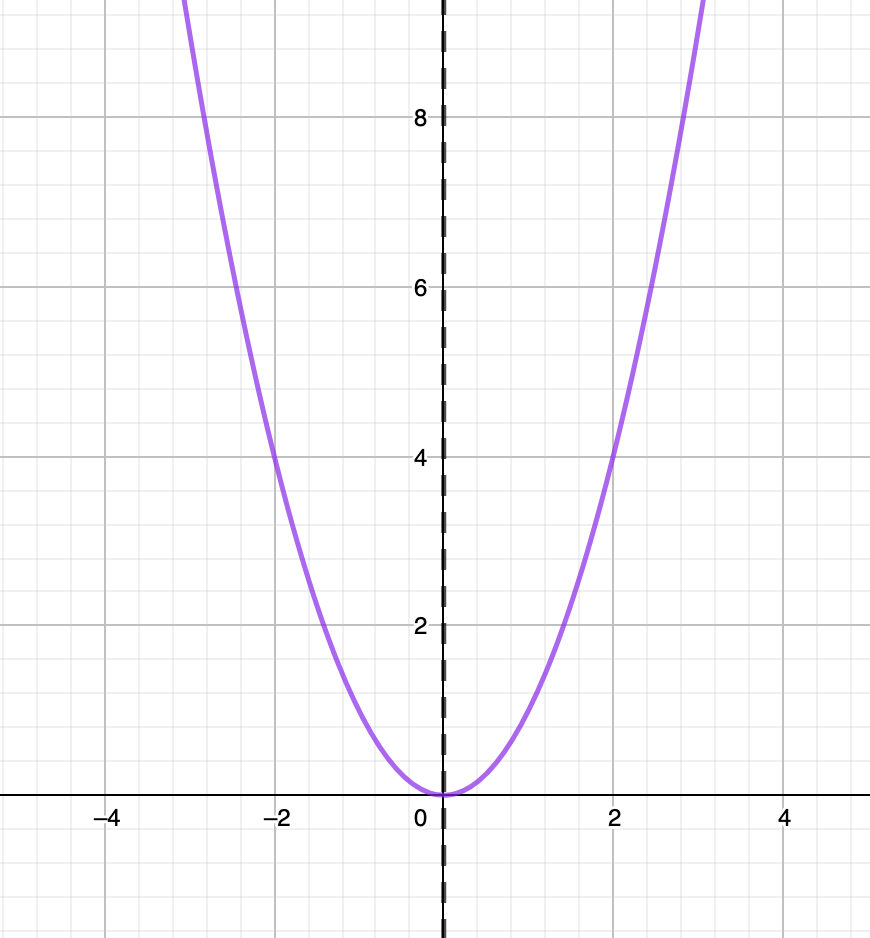

Image illustrating Graphing Reciprocal Functions


Step 5

Draw the horizontal asymptote
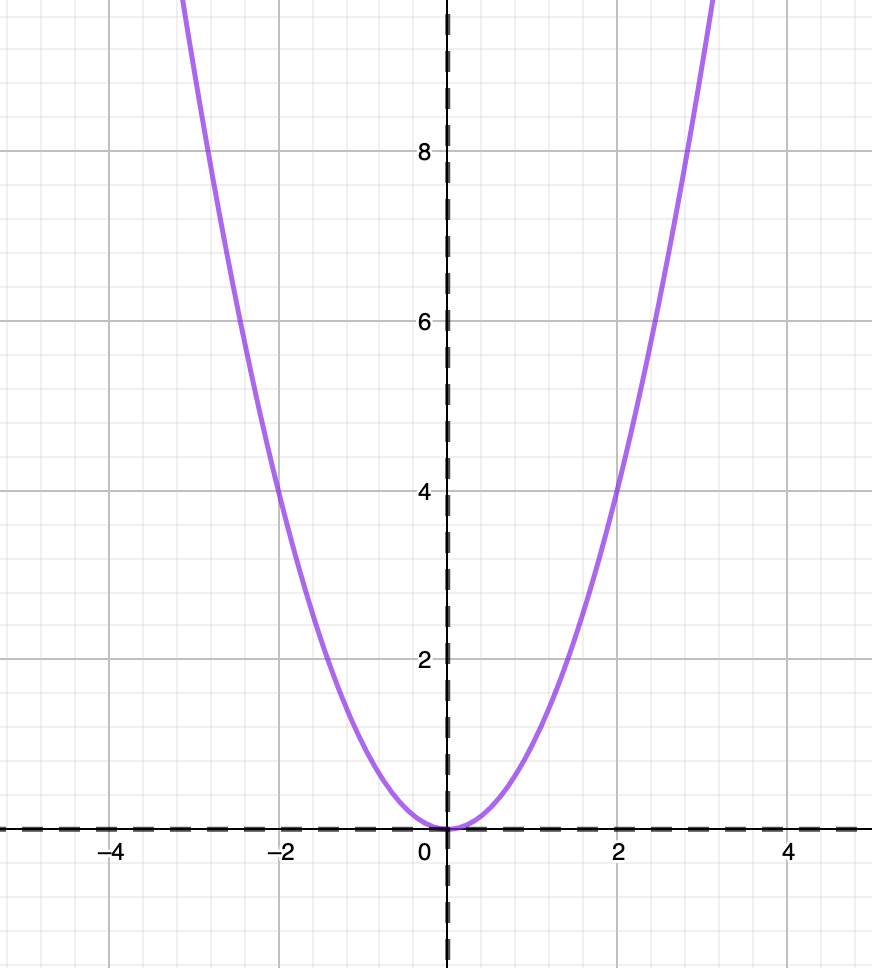

Image illustrating Graphing Reciprocal Functions


Step 6.

Start from the critical points and draw the graph towards the asymptotes.


The end behaviour of y=x2 y=x^2~:

x→∞,y→∞x→−∞,y→∞x\rightarrow\infin,y\rightarrow\infin\newline{} x\rightarrow-\infin,y\rightarrow\infin


The end behaviour of y=1x2y=\dfrac{1}{x^2} is:

x→∞,y→0x→−∞,y→0x\rightarrow\infin,y\rightarrow0\newline{} x\rightarrow-\infin,y\rightarrow0


Image illustrating Graphing Reciprocal Functions


Create a free account to get started

Unlock full course notes by signing up

  • Video lessons taught by top educators
  • Practice questions with guided solutions
  • Written review notes for reference
  • Expert answers anytime from course tutors

Example: Graphing Reciprocal of a Linear Function


a) Sketch y=2x+3y=2x+3, identifying the end behaviour & x-intercepts.


b) Use the information from part a) to sketch a graph of the reciprocal function y=12x+3y=\displaystyle\frac{1}{2x+3}, identifying vertical asymptotes, horizontal asymptotes, & critical points


Step 1.

Sketch y=2x+3\green{y=2x+3}
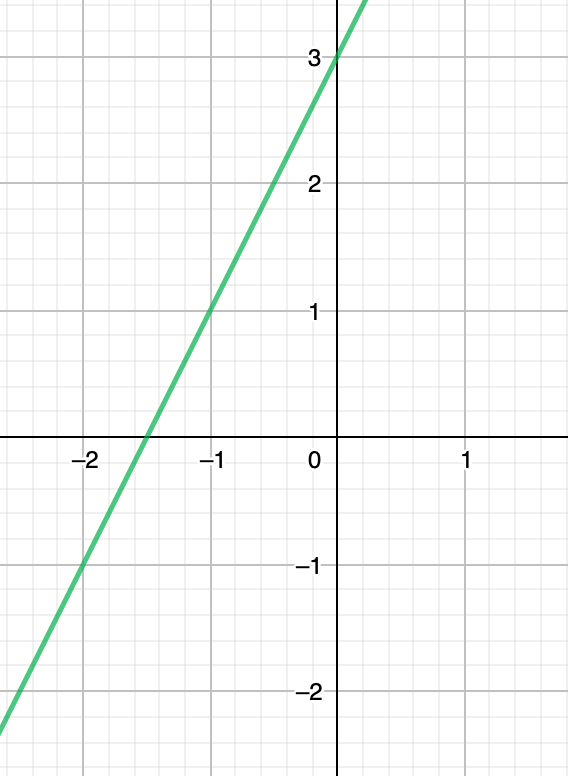
Image illustrating Example xy−2−1−1103152739411\begin{array}{|c|c|}\hline x&y\\\hline -2&-1\\\hline -1&1\\\hline 0&3\\\hline 1&5\\\hline 2&7\\\hline 3&9\\\hline 4&11\\\hline \end{array}


Step 2.

Identify the x-intercepts on y=2x+3\green{y=2x+3}


The x-intercept is at (−1.5,0)(-1.5,0)


Step 3.

Identify the points of intersection between y=2x+3\green{y=2x+3} and y=±1\green{y=\pm1} (critical points)


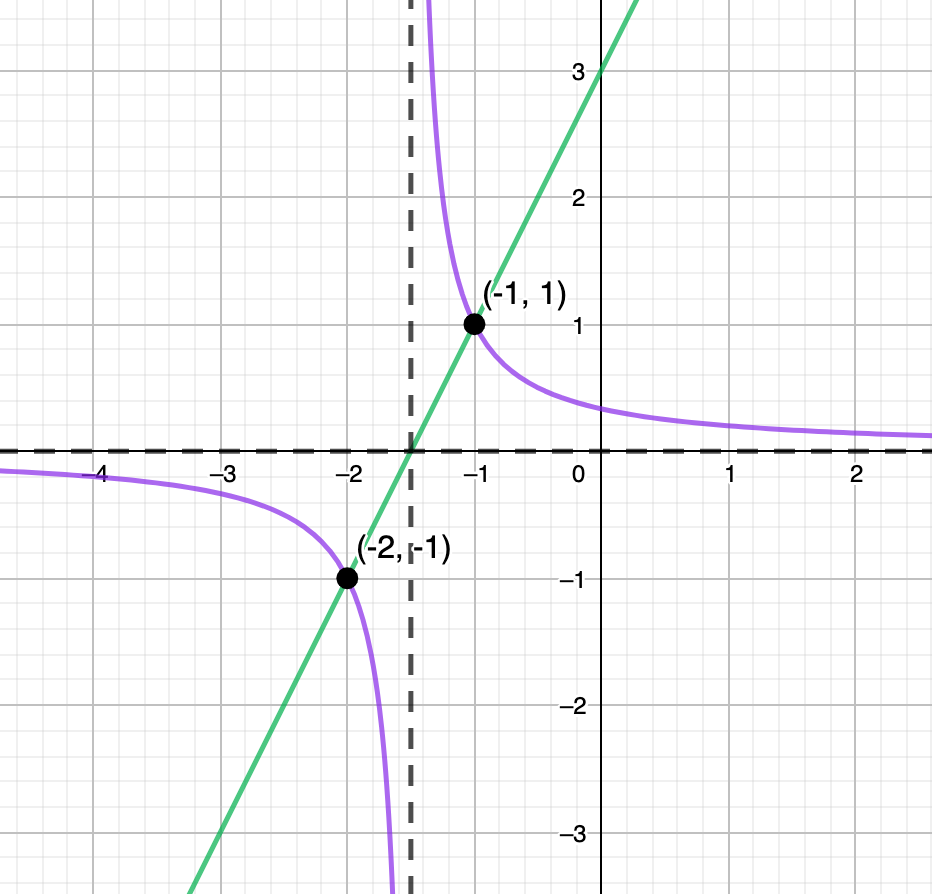
The points of intersection are (−1,1)  &  (−2,−1)(-1, 1)~~\&~~(-2, -1)


Step 4.

Turn the x-intercepts into vertical asymptotes & draw the vertical asymptotes


Vertical Asymptote: x=−32x=-\displaystyle\frac{3}{2}
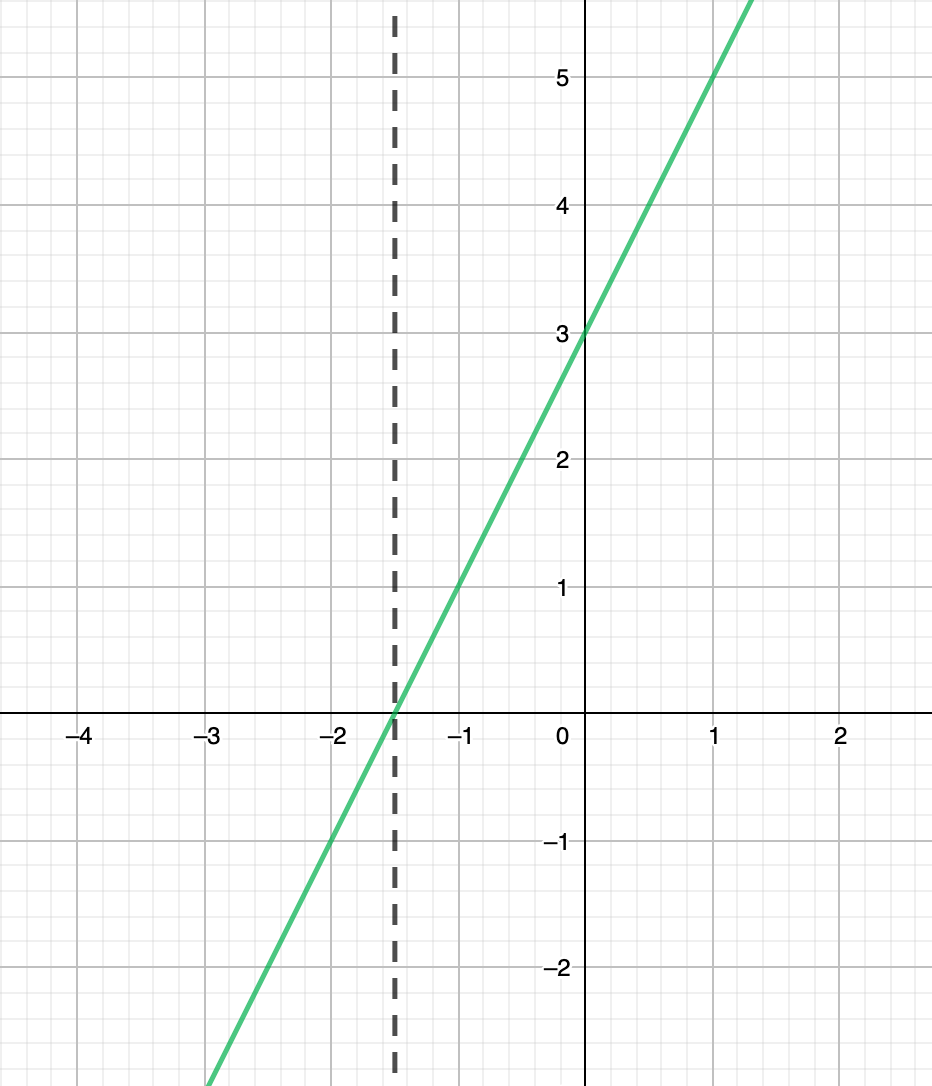

Image illustrating Example


Step 5

Draw the horizontal asymptote y = 0
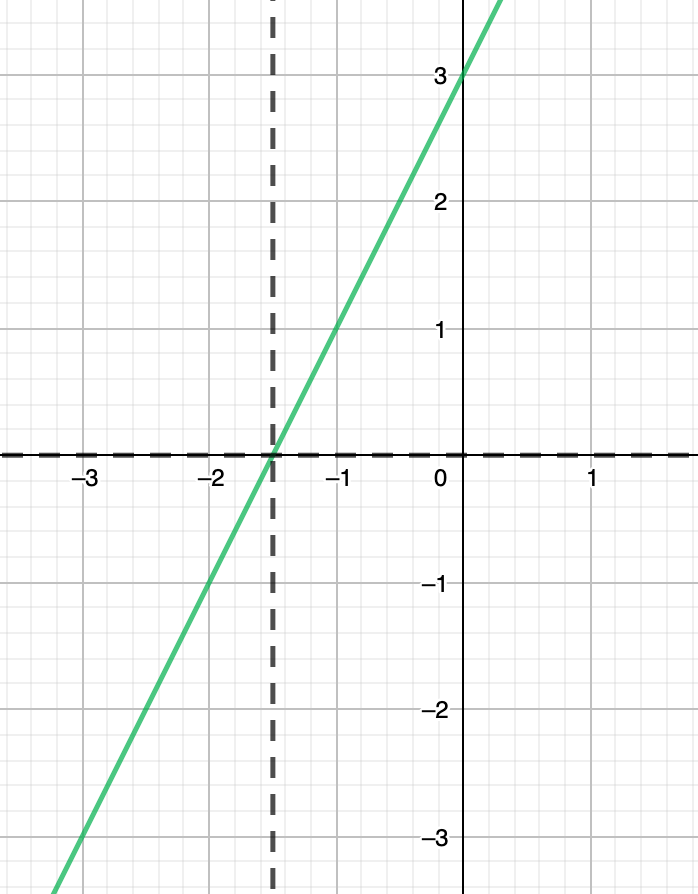

Image illustrating Example


Step 6.

Start from the critical points and draw the graph towards the asymptotes.


The end behaviour of y=2x+3 y=2x+3~:

x→∞,y→∞x→−∞,y−→∞x\rightarrow\infin,y\rightarrow\infin\newline{} x\rightarrow-\infin,y-\rightarrow\infin


The end behaviour of y=12x+3y=\displaystyle\frac{1}{2x+3} is:

x→∞,y→0x→−∞,y→0x\rightarrow\infin,y\rightarrow0\newline{} x\rightarrow-\infin,y\rightarrow0


Image illustrating Example


Create a free account to get started

Unlock full course notes by signing up

  • Video lessons taught by top educators
  • Practice questions with guided solutions
  • Written review notes for reference
  • Expert answers anytime from course tutors

Example: Graphing Reciprocal of a Quadratic Function

a) Sketch y=x2−9y=x^2-9, identifying the end behaviour, x-intercepts, y-intercepts, & any minimums and maximums.


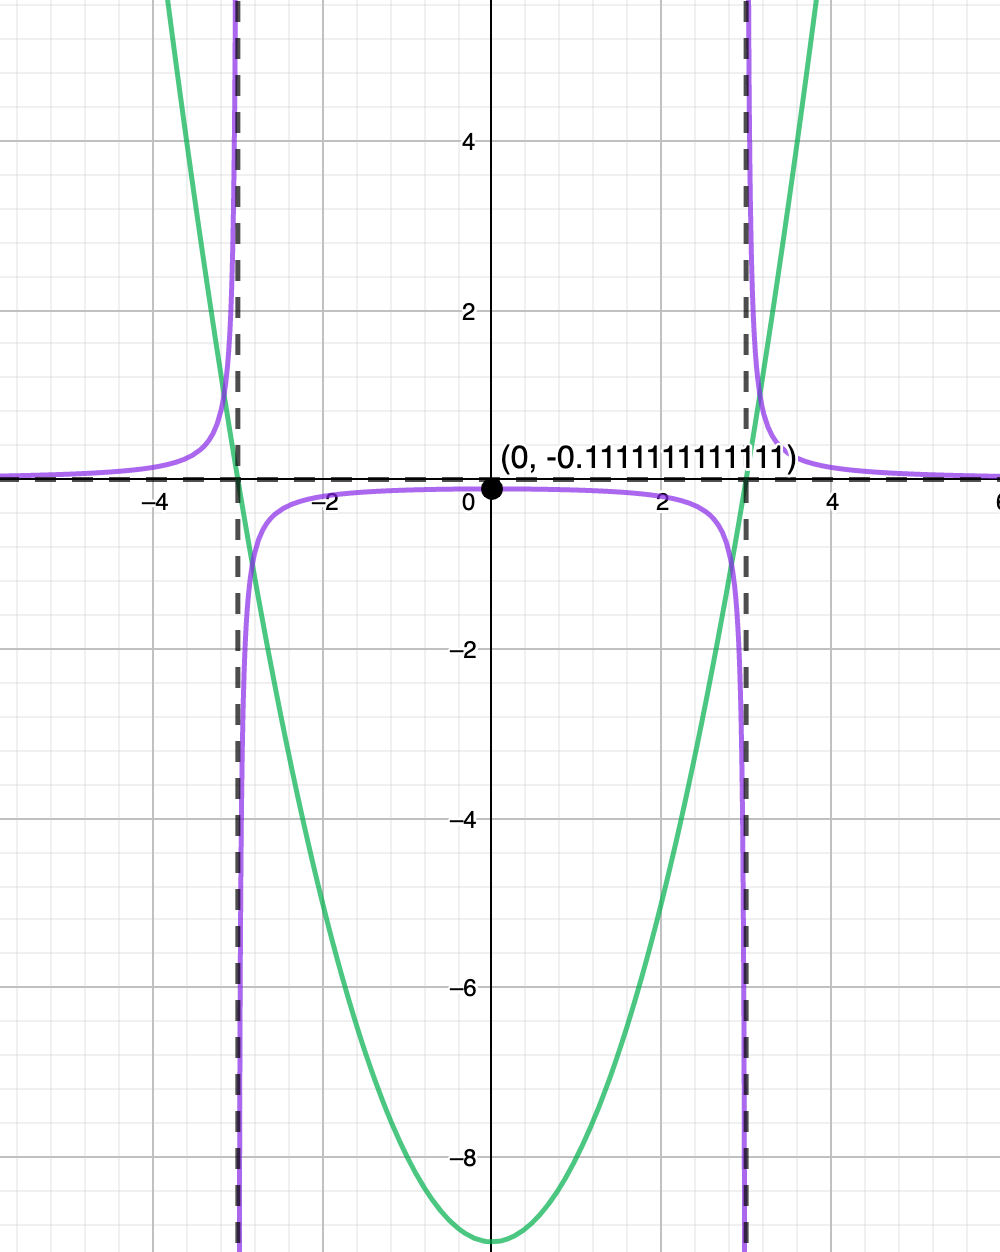
b) Use the information from part a) to sketch a graph of the reciprocal function y=1x2−9y=\displaystyle\frac{1}{x^2-9}, identifying vertical asymptotes, horizontal asymptotes, minimums/maximums, & critical points


Step 1.

Sketch y=x2−9\green{y=x^2-9}
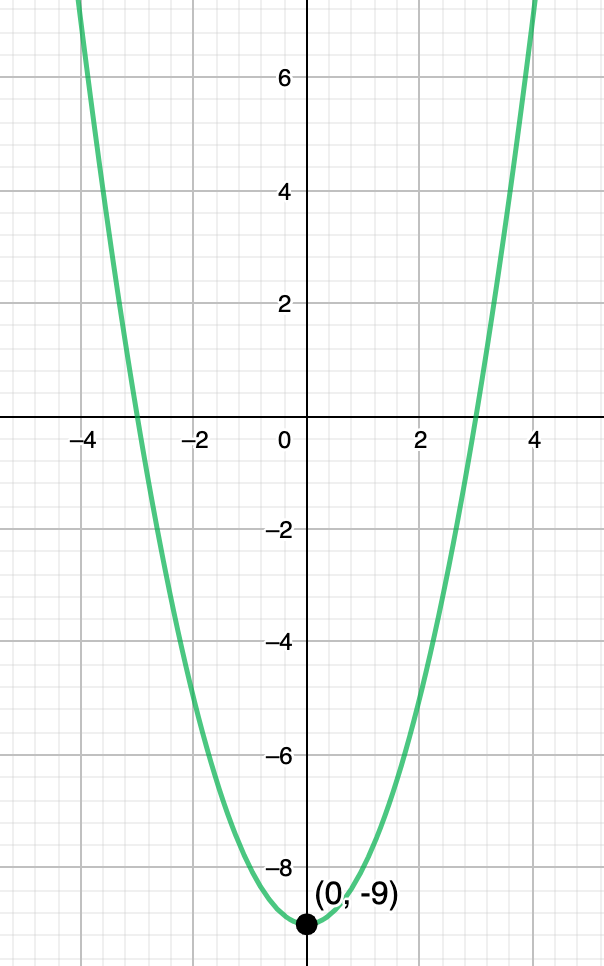

Image illustrating Example xy−39−24−1100112439\begin{array}{|c|c|}\hline x&y\\\hline -3&9\\\hline -2&4\\\hline -1&1\\\hline 0&0\\\hline 1&1\\\hline 2&4\\\hline 3&9\\\hline \end{array}


Step 2.

Identify the x-intercepts, y-intercepts, & min/max on y=x2−9\green{y=x^2-9}


The x-intercept is at (−3,0)  &  (3,0)(-3,0)~~\&~~(3, 0)


The y-intercept is at (0,−9)(0,-9)


The minimum is at (0,−9)(0,-9)


Step 3.

Identify the points of intersection between y=x2−9\green{y=x^2-9} and y=±1\green{y=\pm1} (critical points)


The points of intersection are (±10,1)  &  (±8,−1)(\pm\sqrt{10},1)~~\&~~(\pm\sqrt{8},-1)


Step 4.

Turn the x-intercepts into vertical asymptotes & draw the vertical asymptotes


Vertical Asymptotes: x=±3x=\pm3
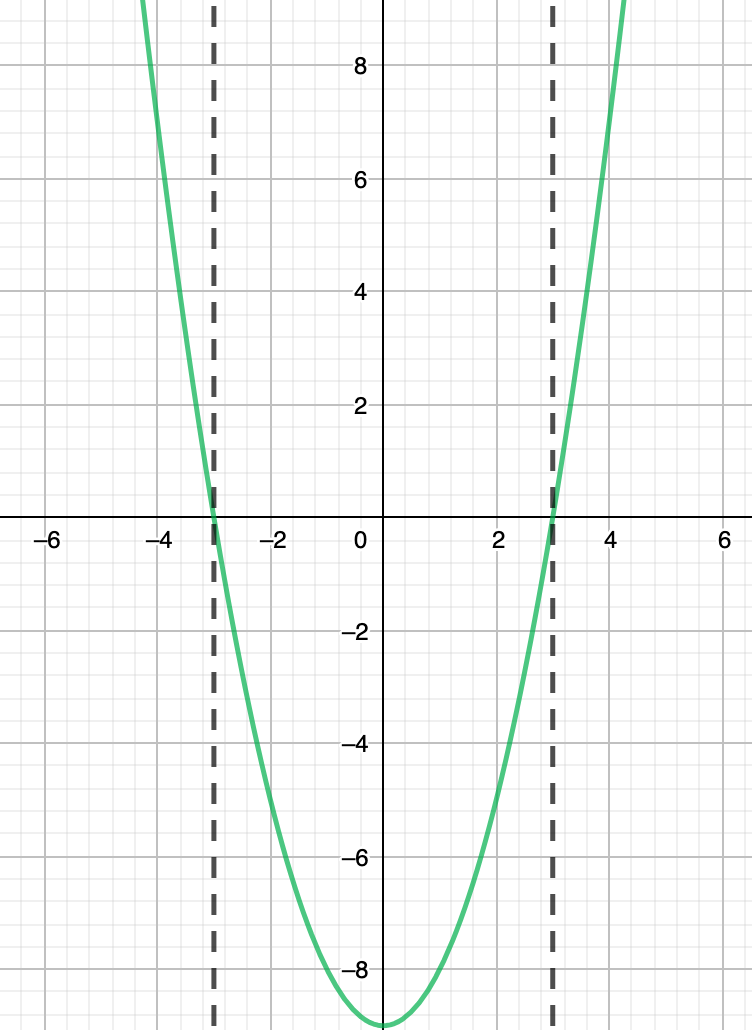

Image illustrating Example


Step 5

Draw the horizontal asymptote y = 0
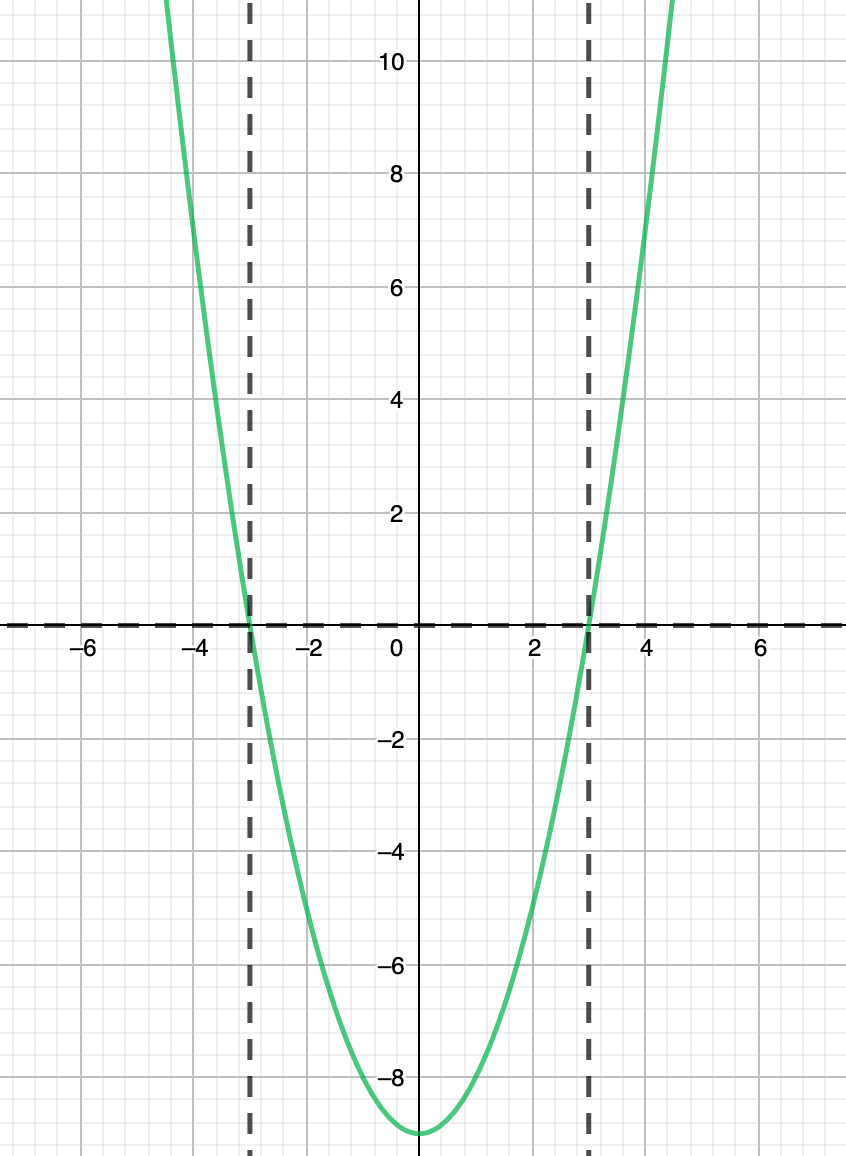

Image illustrating Example


Step 6.

Start from the critical points and draw the graph towards the asymptotes.


The minimum (0,−9)(0,-9) turns into a maximum (0,−19)(0,-\frac{1}{9})


The end behaviour of y=x2−9 y=x^2-9~:

x→∞,y→∞x→−∞,y→∞x\rightarrow\infin,y\rightarrow\infin\newline{} x\rightarrow-\infin,y\rightarrow\infin


The end behaviour of y=1x2−9y=\displaystyle\frac{1}{x^2-9} is:

x→∞,y→0x→−∞,y→0x\rightarrow\infin,y\rightarrow0\newline{} x\rightarrow-\infin,y\rightarrow0


Image illustrating Example

Create a free account to get started

Unlock full course notes by signing up

  • Video lessons taught by top educators
  • Practice questions with guided solutions
  • Written review notes for reference
  • Expert answers anytime from course tutors

Example: Graphing Reciprocal of a Quadratic Function

a) Sketch y=x2+4y=x^2+4, identifying the end behaviour & x-intercepts.


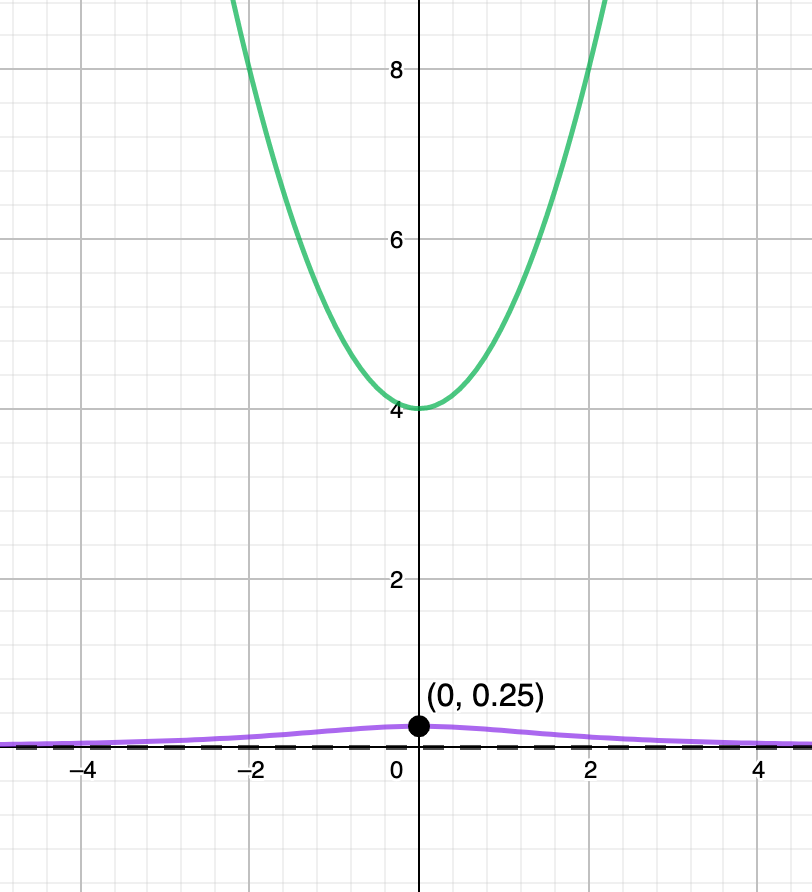
b) Use the information from part a) to sketch a graph of the reciprocal function y=1x2+4y=\displaystyle\frac{1}{x^2+4}, identifying vertical asymptotes, horizontal asymptotes, & critical points


Step 1.

Sketch y=x2+4\green{y=x^2+4}
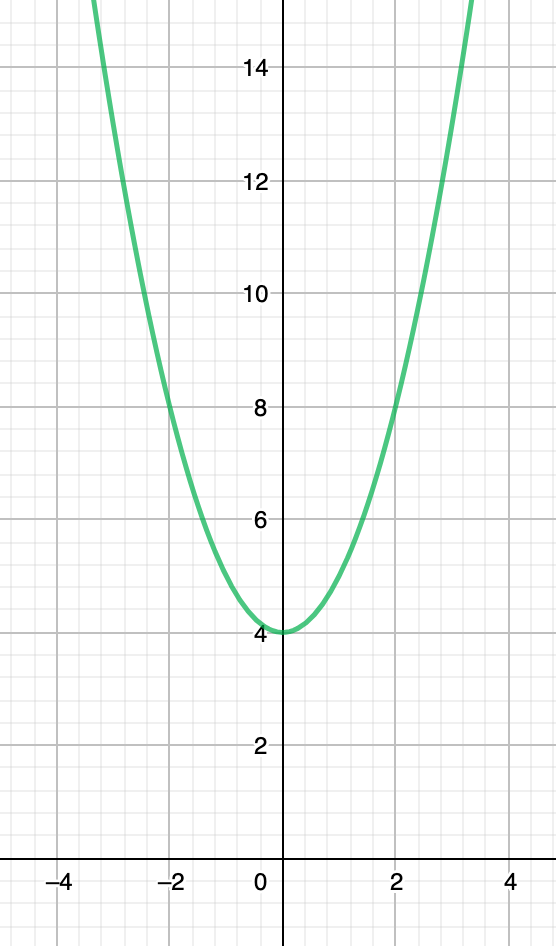

Image illustrating Examplexy−28−15041528\begin{array}{|c|c|}\hline x&y\\\hline -2&8\\\hline -1&5\\\hline 0&4\\\hline 1&5\\\hline 2&8\\\hline \end{array}


Step 2.

Identify the x-intercepts on y=x2+4\green{y=x^2+4}


There are no x-intercepts.


Step 3.

Identify the points of intersection between y=x2+4\green{y=x^2+4} and y=±1\green{y=\pm1} (critical points)


There are no points of intersection.


Step 4.

Turn the x-intercepts into vertical asymptotes & draw the vertical asymptotes


There are no vertical asymptotes.


Step 5

Draw the horizontal asymptote y = 0
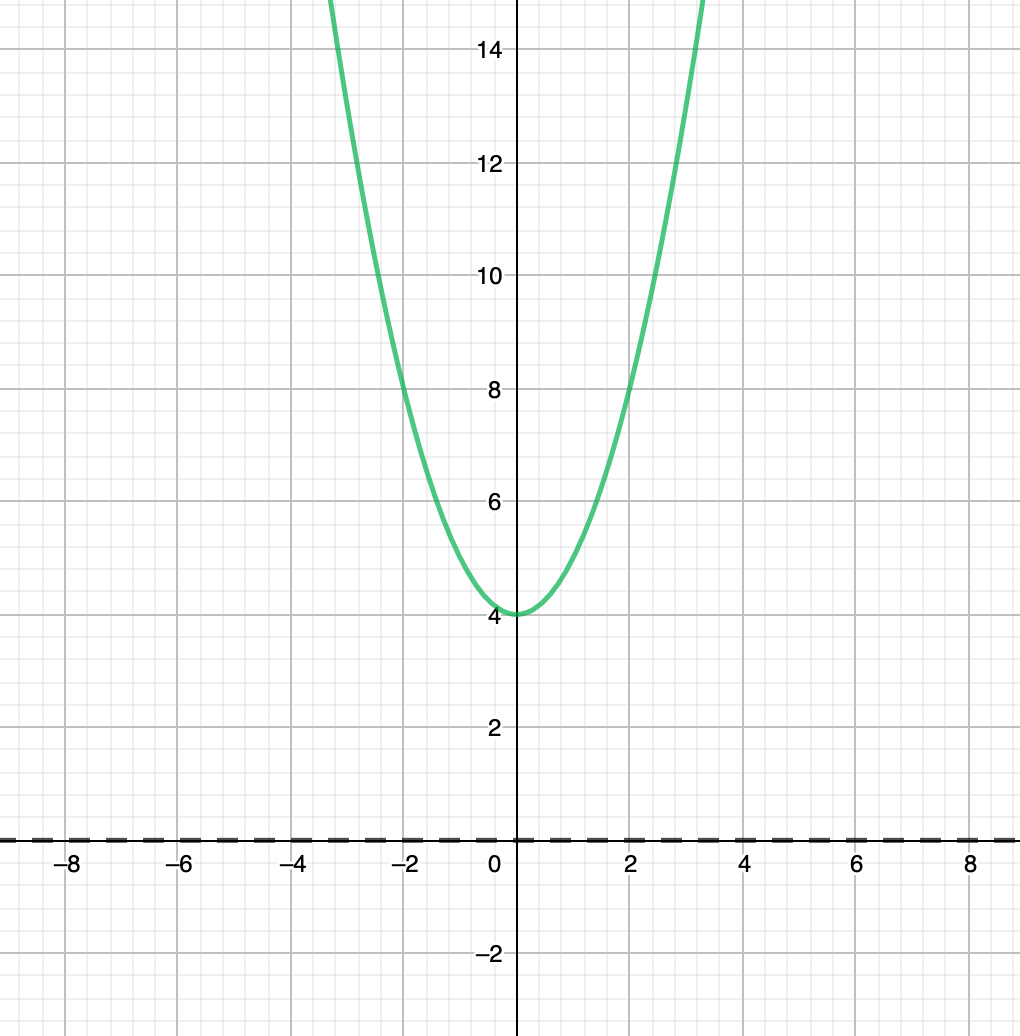

Image illustrating Example


Step 6.

Start from the critical points and draw the graph towards the asymptotes.


The minimum (0,4)(0,4) turns into a maximum (0,14)(0,\frac{1}{4})


The end behaviour of y=x2+4 y=x^2+4~:

x→∞,y→∞x→−∞,y→∞x\rightarrow\infin,y\rightarrow\infin\newline{} x\rightarrow-\infin,y\rightarrow\infin


The end behaviour of y=1x2+4y=\displaystyle\frac{1}{x^2+4} is:

x→∞,y→0x→−∞,y→0x\rightarrow\infin,y\rightarrow0\newline{} x\rightarrow-\infin,y\rightarrow0


Image illustrating Example


Practice: Graphing Reciprocal Functions

Sketch a graph of the reciprocal of the function below:


Illustration for practice question: Graphing Reciprocal Functions


Choose an answer

Create a free account to get started

Unlock full course notes by signing up

  • Video lessons taught by top educators
  • Practice questions with guided solutions
  • Written review notes for reference
  • Expert answers anytime from course tutors

Practice: Graphing Reciprocal Functions

Sketch a graph of y=(x−3)2−4y=(x-3)^2-4 and it's reciprocal on the same grid, labeling all asymptotes & minimum/maximums points.

Choose an answer

Create a free account to get started

Unlock full course notes by signing up

  • Video lessons taught by top educators
  • Practice questions with guided solutions
  • Written review notes for reference
  • Expert answers anytime from course tutors

Practice: Graphing Reciprocal Functions

Determine the equation for the function graphed below:


Illustration for practice question: Graphing Reciprocal Functions


Your answers

Create a free account to get started

Unlock full course notes by signing up

  • Video lessons taught by top educators
  • Practice questions with guided solutions
  • Written review notes for reference
  • Expert answers anytime from course tutors