Wize High School Grade 10 Math Textbook > Quadratic Relations
Quadratic Relations
Popular Courses
Grade 10 Math
Canada High School
Algebra I
US High School
DAT
General Course
Grade 10 Principles of Mathematics
Ontario High School
QMS 110
Toronto Metropolitan University
Grade 10 Foundations of Mathematics
Ontario High School
MA129
Wilfrid Laurier University
MATH 202
Concordia University
MATH 16A
University of California - Berkeley
MATH 1148
Ohio State University
0:00 / 0:00
Quadratic Relations
Recall - Linear Relations
Linear relations is a special types of relationship between two variables
- When the value of the independent variable changes, the value of the dependent variable changes by a proporationate amount
- In a table of values representing a linear relation, we will see constant first differences
- In an equation representing a linear relation, we will see a degree of 1 for both independent and dependent variables
- In a graph represending a linear relation, we will see a straight line

But what if a relation is not linear, are there other types of special relations?
Paper Airplane Experiment

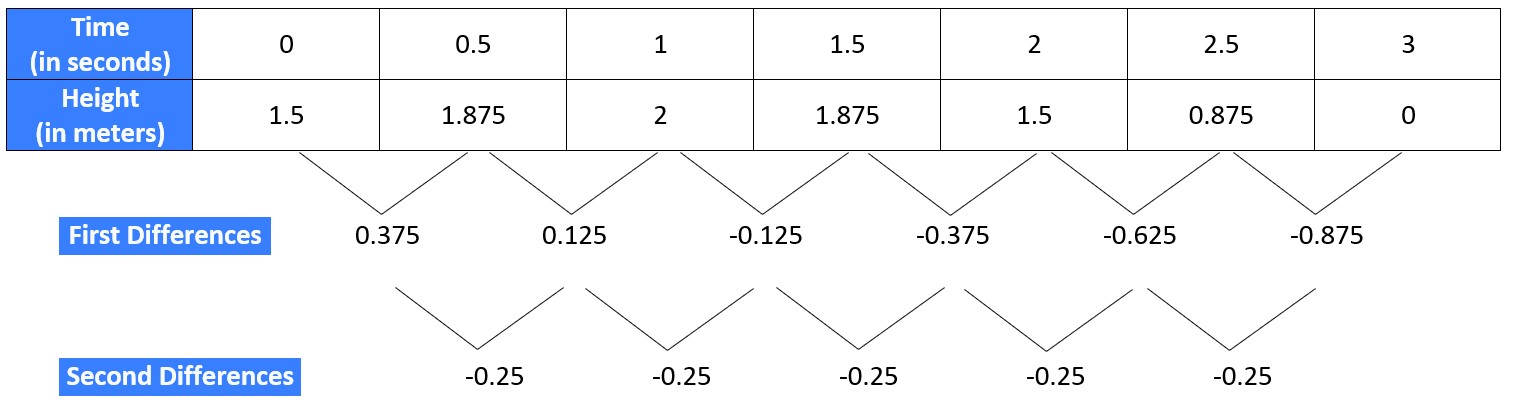
A paper plane is launched into the air. The following table shows the height of this plane at different points in time. Create a scatter plot and sketch the curve of best fit for this experiment.

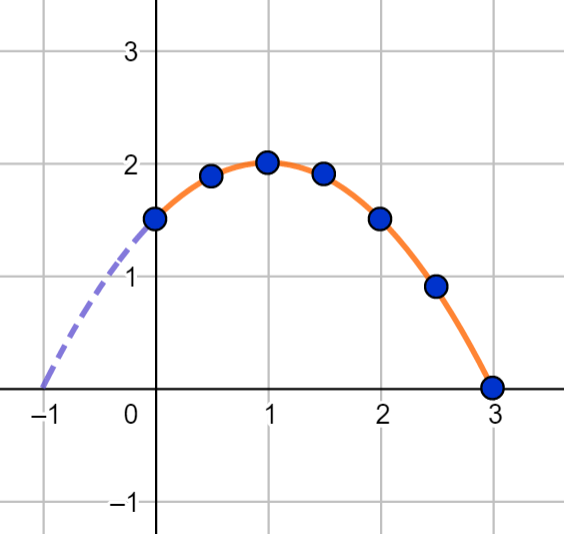
What are some special features of this relation?
- Shape of the curve of best fit:
- If we extend the graph beyond 0, into the negative time values, we notice the curve of best fit is symmetric.
- Is the dependent variable increasing or decreasing?
- The curve of best fit increases as before time reaches 1.5 seconds, then it decreases at the same rate.
- If we extend the curve of best fit, what do we know about its intercepts?
- The curve of best fit crosses the y-axis once, so there is one y-intercept. But if we extend the curve, we see that it crosses the x-axis twice, so there are two x-intercepts.
- What do you notice about the first and second differences from the table of values?
- The first differences are not constant, but the second differences are constant
Quadratic Relation
Two variables are related and have a quadratic relation if it has the following properties:
- The graph of the relation is a parabola -- a symmetric "U" shape
- The table of value for this relation has a constant second difference that is not zero
- The equation of the relation has degree 2
Different Forms of the Quadratic Equation
A quadratic equation must have degree 2, but there are a few different possible forms:
- Standard form:
- Factored form:
- Vertex form:
0:00 / 0:00
Example: Quadratic Relation
Show that the following are quadratic relations. If the graph is not given, sketch the graph.
a)
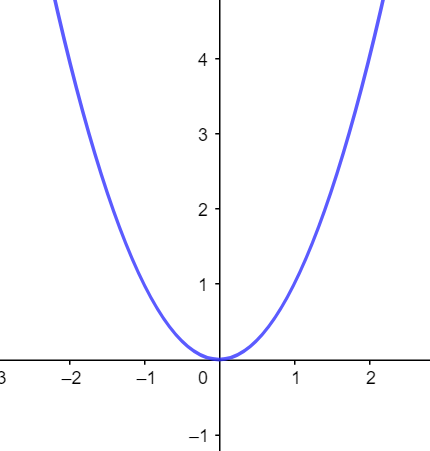
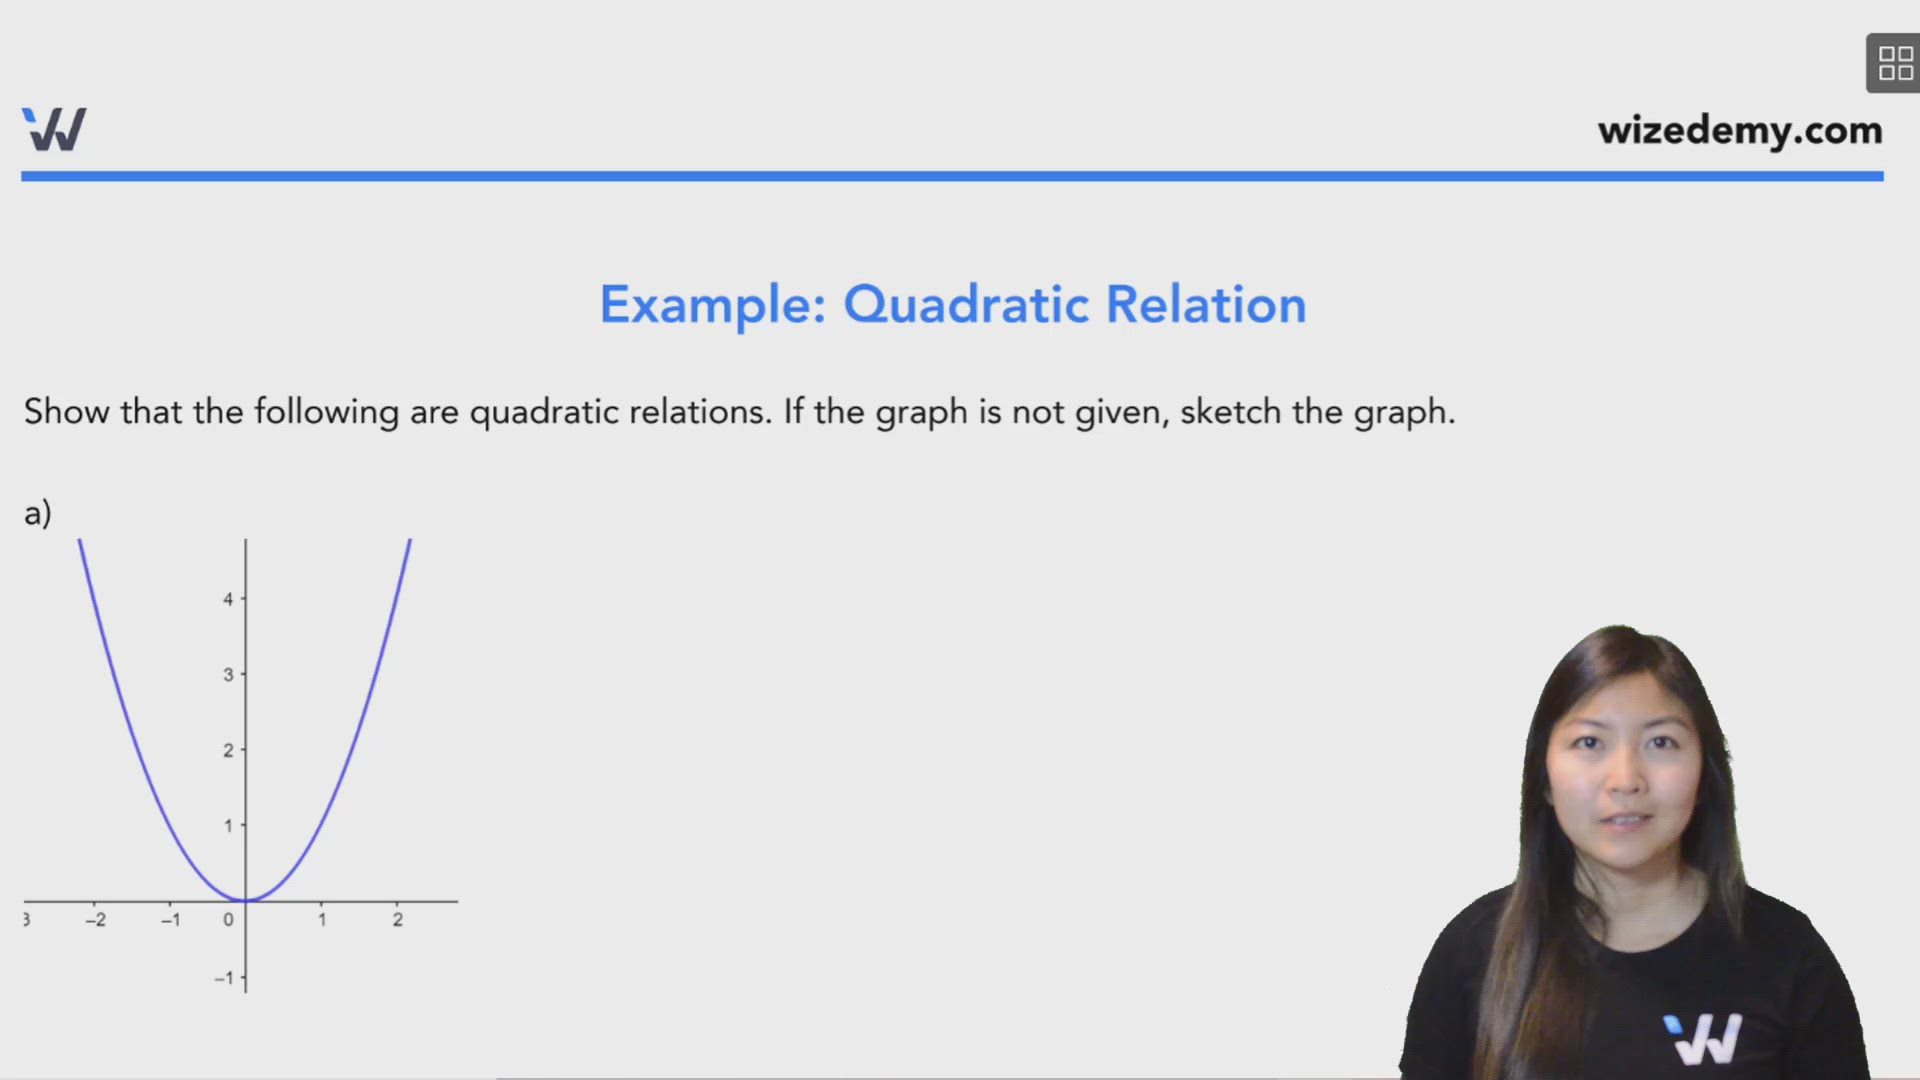
The graph is a parabola ("U" shape). It is symmetrical along the y-axis, it is decreasing to the left of the y-axis and increasing to the right of the y-axis.
b)

Looking at this table of values, you can see that the y-values appear to be symmetric, but let's determine the second differences to be sure that this is a quadratic relation.
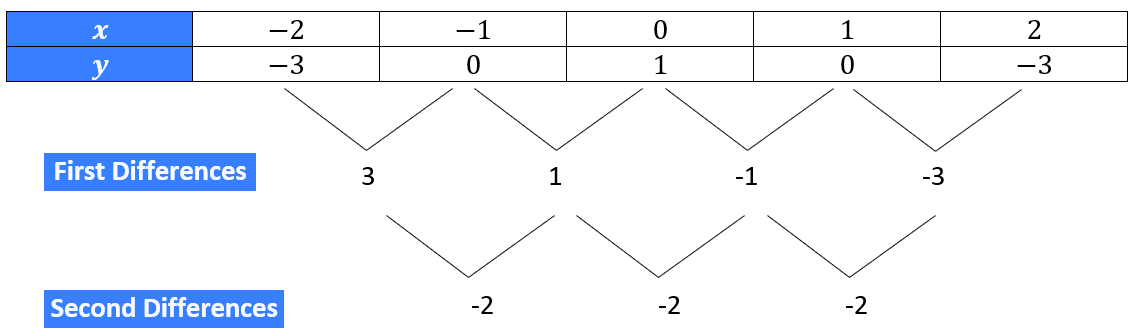
Since the second differences are constant, this does represent a quadratic relation.
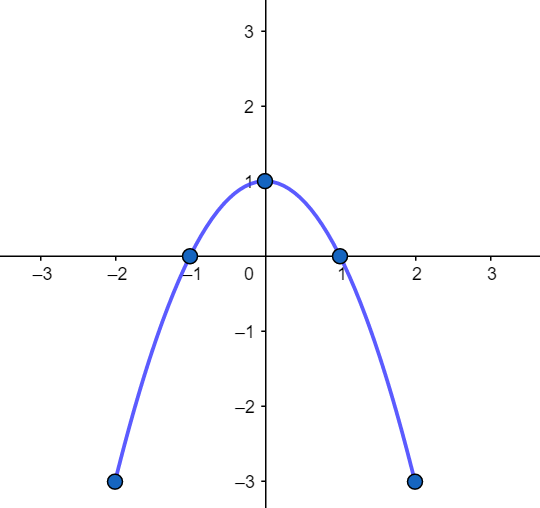
Here is the graph of the relation:
c)
Let's first expand and simplify the expression:
We see that this equation is of the form , it has degree 2. So, it is a quadratic relation.
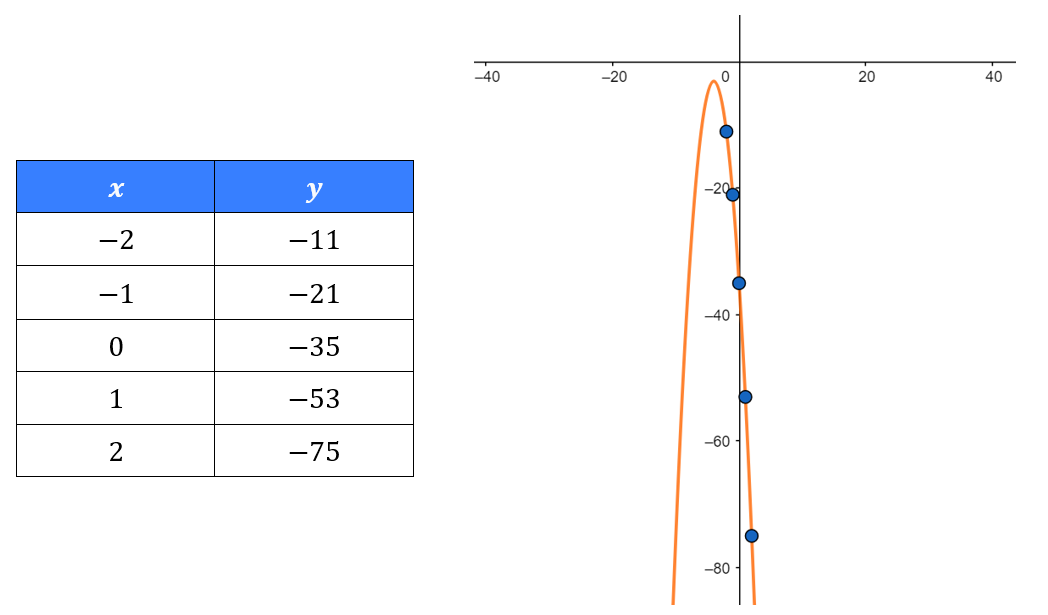
Here's the graph for this relation:

Mark Yourself Question
- Grab a piece of paper and try this problem yourself.
- When you're done, check the "I have answered this question" box below.
- View the solution and report whether you got it right or wrong.
Practice: Quadratic Relation
i) Show that the following are quadratic relations
ii) If the graph is not given, sketch the graph representing the quadratic relation.
a)
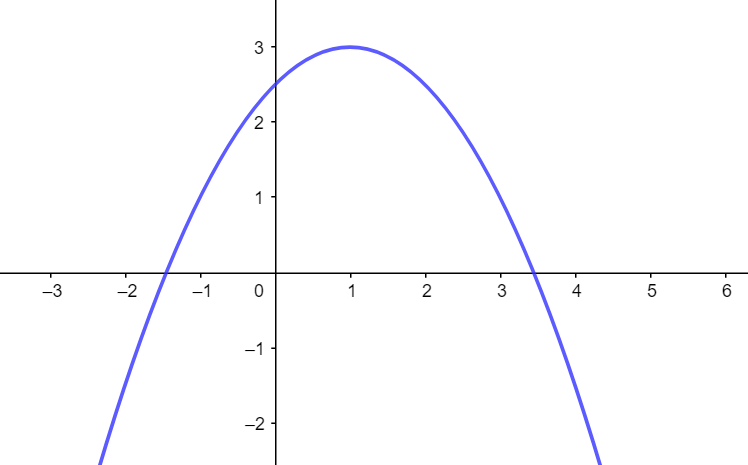
b)

c)
Practice: Quadratic VS Linear Relations
For each of the following relations,
a) indicate the degree of the relation
b) state whether it represents a linear relation, quadratic relation, or neither.
Practice: Quadratic Relations
Select all of the situations that can be modelled with a quadratic relation.