Wize High School Grade 12 Pre-Calculus Textbook > Rational Functions
Graphing Rational Functions
Popular Courses
Grade 12 Advanced Functions
Ontario High School
Grade 12 Pre-Calculus/Functions
Canada High School
Algebra II
US High School
Math 30-1
Alberta High School
Pre-Calculus 12
British Columbia High School
MATH 206
Concordia University
MTH 103
Michigan State University
MATH 22
Pennsylvania State University
MAC 1140
University of Florida
MATH 41
Pennsylvania State University
MATH 150
Texas A&M University
MATH 202
Concordia University
MAT 170
Arizona State University - Tempe
MAC 1105
Florida State University
MAT 012
University of California - Davis
MATH 1148
Ohio State University
MTH 103A
Michigan State University
MTH 116
Michigan State University
MAC 1147
University of Florida
MATH 140
San Diego State University

0:00 / 0:00
Graphing Rational Functions
Steps for graphing a rational function :
- Factor, if necessary
- Find the -intercepts & -intercepts
- Find the vertical asymptotes
- Find the horizontal asymptotes
- Find the missing points/holes
- Use a table of signs to determine if the function, , will be above or below the horizontal asymptote. Any vertical asymptotes & x-intercepts will be used to determine the behaviour of
- Plot the function using the information found in Steps 1 - 6.
Example
Graph , stating the domain and range.
Step 1.
Factor, if necessary.
Factoring will not be required since is in simplest form already.
Step 2.
Find the x-intercepts & y-intercepts.
The x-intercepts are determined by allowing :
The y-intercepts are determined by allowing :
Step 3.
Find the vertical asymptotes.
The vertical asymptotes can found by finding the zeros of the denominator. In other words, set the denominator to and solve.
Let .
The vertical asymptote is
Step 4.
Find the horizontal asymptotes.
The degree of the polynomial in the numerator is equivalent to the degree of the polynomial in the denominator .
Therefore, the horizontal asymptote for is the ratio of the leading coefficients .
Step 5.
Find the missing points/holes.
There were no terms eliminated. Therefore, there are no missing points/holes.
Step 6.
Use a table of signs to determine if the function, , will be above or below the horizontal asymptote. Any vertical asymptotes & x-intercepts will be used to determine the behaviour of
Pick values of around the vertical asymptotes and x-intercpets
The function lies above the horizontal asymptote in the interval
The function lies below the horizontal asymptote in the interval
Step 7.
Plot the function using the information found in Steps 1 - 6.
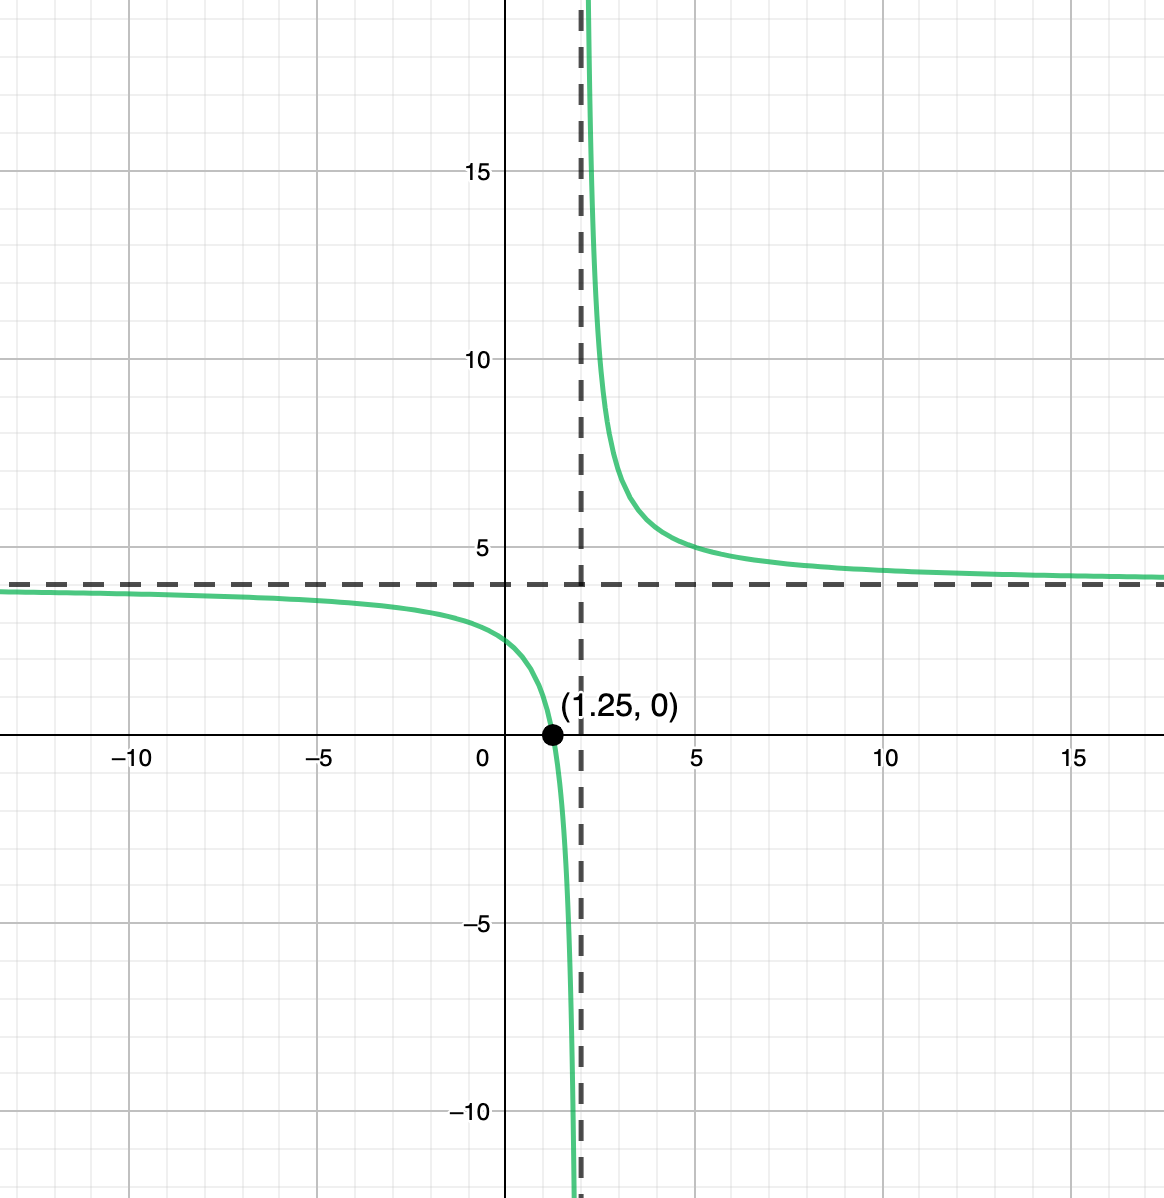
Domain:
Range:
0:00 / 0:00
Example: Graphing Rational Functions
Sketch a graph of .
Step 1.
Factor, if necessary.
Step 2.
Find the x-intercepts & y-intercepts.
The x-intercepts are determined by allowing :
The y-intercepts are determined by allowing :
Step 3.
Find the vertical asymptotes.
The vertical asymptotes can found by finding the zeros of the denominator. In other words, set the denominator to and solve.
Let .
The vertical asymptotes are
Step 4.
Find the horizontal asymptotes.
The degree of the polynomial in the numerator is not equivalent to the degree of the polynomial in the denominator .
Therefore, the horizontal asymptote for is the ratio of the leading coefficients .
Step 5.
Find the missing points/holes.
There were no terms eliminated. Therefore, there are no missing points/holes.
Step 6.
Use a table of signs to determine if the function, , will be above or below the horizontal asymptote. Any vertical asymptotes & x-intercepts will be used to determine the behaviour of
Pick values of around the vertical asymptotes and x-intercpets
The function lies above the horizontal asymptote in the interval
The function lies below the horizontal asymptote in the interval
Step 7.
Plot the function using the information found in Steps 1 - 6.
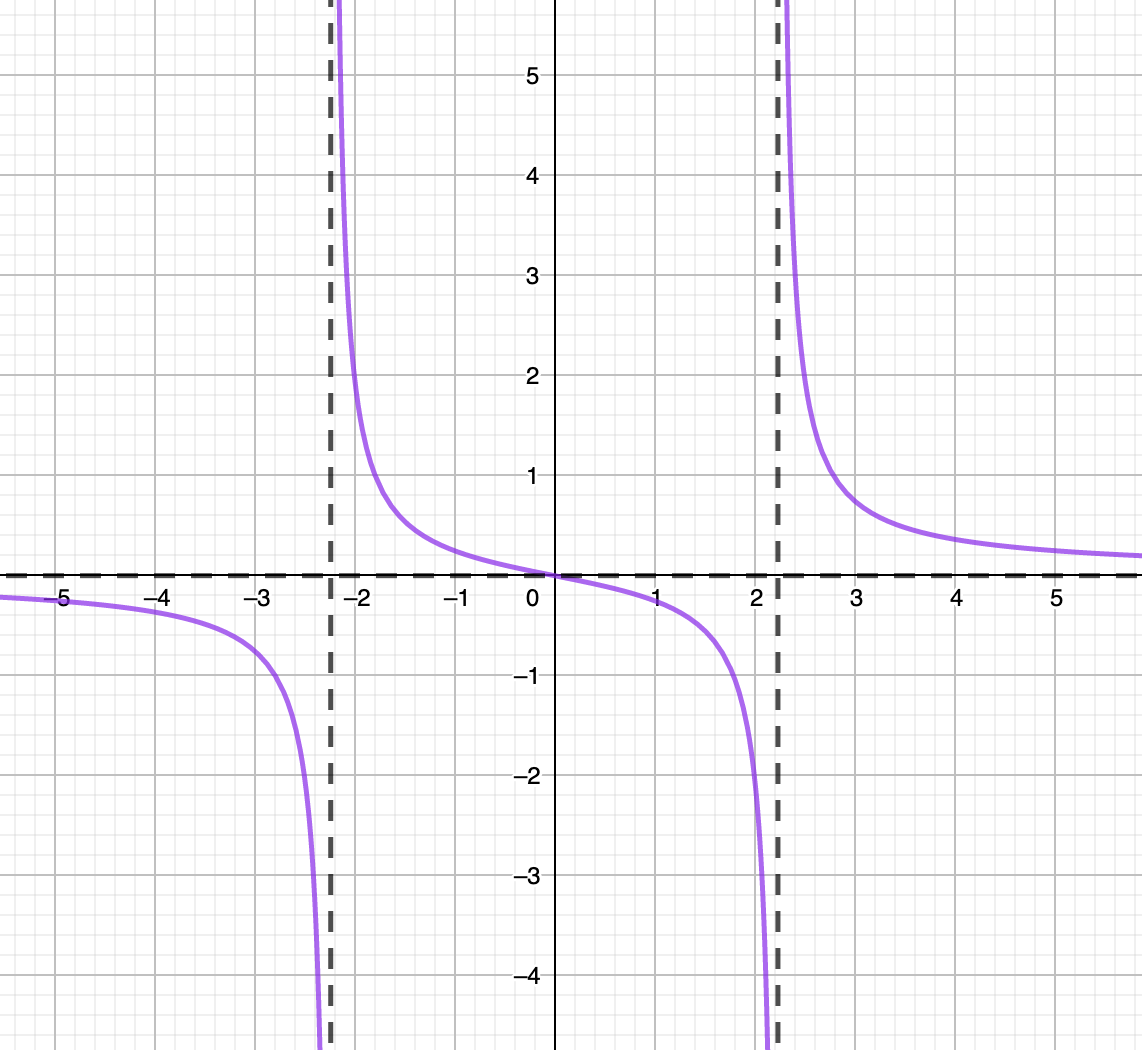
Domain:
Range:
0:00 / 0:00
Example: Graphing Rational Functions
Sketch a graph of .
Step 1.
Factor, if necessary.
Step 2.
Find the x-intercepts & y-intercepts.
The x-intercepts are determined by allowing :
The y-intercepts are determined by allowing :
Step 3.
Find the vertical asymptotes.
The vertical asymptotes can found by finding the zeros of the denominator. In other words, set the denominator to and solve.
Let .
The vertical asymptote is
Step 4.
Find the horizontal asymptotes.
The degree of the polynomial in the numerator is equivalent to the degree of the polynomial in the denominator .
Therefore, the horizontal asymptote for is the ratio of the leading coefficients .
Step 5.
Find the missing points/holes.
There were no terms eliminated. Therefore, there are no missing points/holes.
Step 6.
Use a table of signs to determine if the function, , will be above or below the horizontal asymptote. Any vertical asymptotes & x-intercepts will be used to determine the behaviour of
Pick values of around the vertical asymptotes and x-intercpets
The function lies above the horizontal asymptote in the interval
The function lies below the horizontal asymptote in the interval
Step 7.
Plot the function using the information found in Steps 1 - 6.
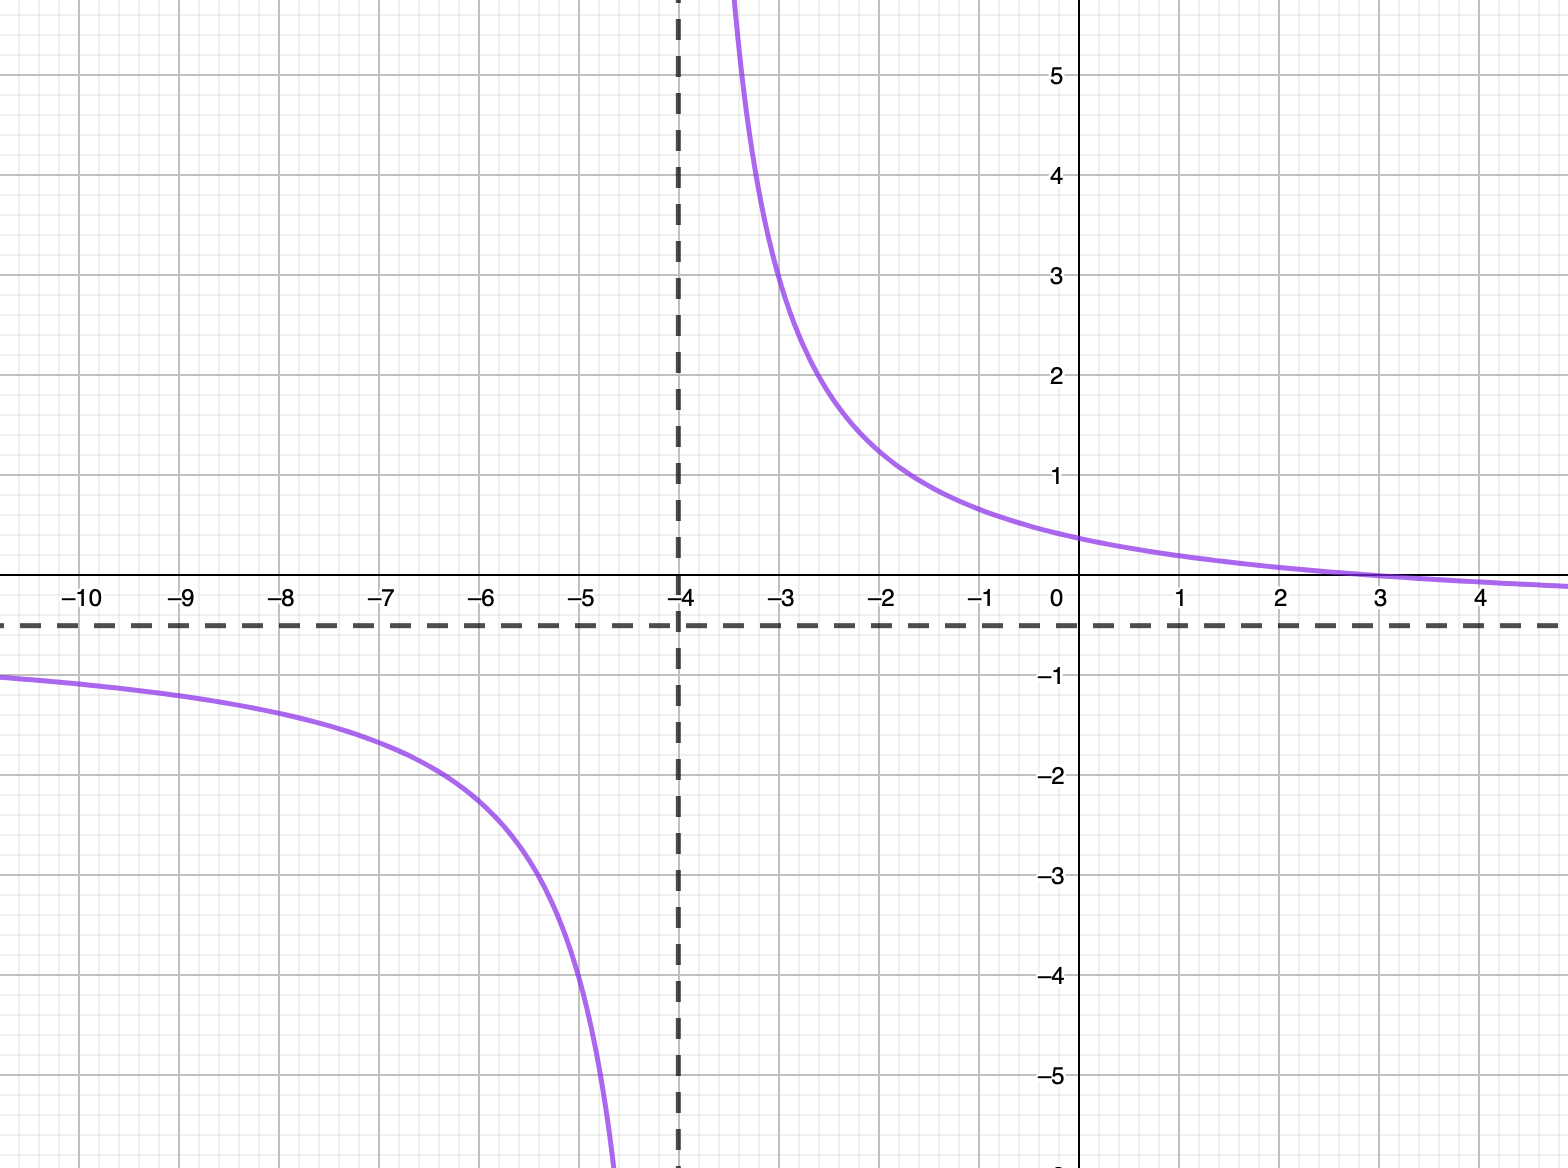
Domain:
Range:
0:00 / 0:00
Example: Graphing Rational Functions
Sketch a graph of
Step 1.
Factor, if necessary.
Step 2.
Find the x-intercepts & y-intercepts.
The x-intercepts are determined by allowing :
The y-intercepts are determined by allowing :
Step 3.
Find the vertical asymptotes.
The vertical asymptotes can found by finding the zeros of the denominator. In other words, set the denominator to and solve.
Let .
The vertical asymptotes is
Step 4.
Find the horizontal (or oblique) asymptotes.
The degree of the polynomial in the numerator is not equivalent to the degree of the polynomial in the denominator .
Therefore, there is an oblique asymptote.
Divide
Divide the quotient by 2:
The oblique asymptote is the quotient. So,
Step 5.
Find the missing points/holes.
There were no terms eliminated. Therefore, there are no missing points/holes.
Step 6.
Use a table of signs to determine if the function, , will be above or below the oblique asymptote. Any vertical asymptotes & x-intercepts will be used to determine the behaviour of
Pick values of around the vertical asymptotes and x-intercepts
The function lies above the oblique asymptote in the interval
The function lies below the oblique asymptote in the interval
Step 7.
Plot the function using the information found in Steps 1 - 6.
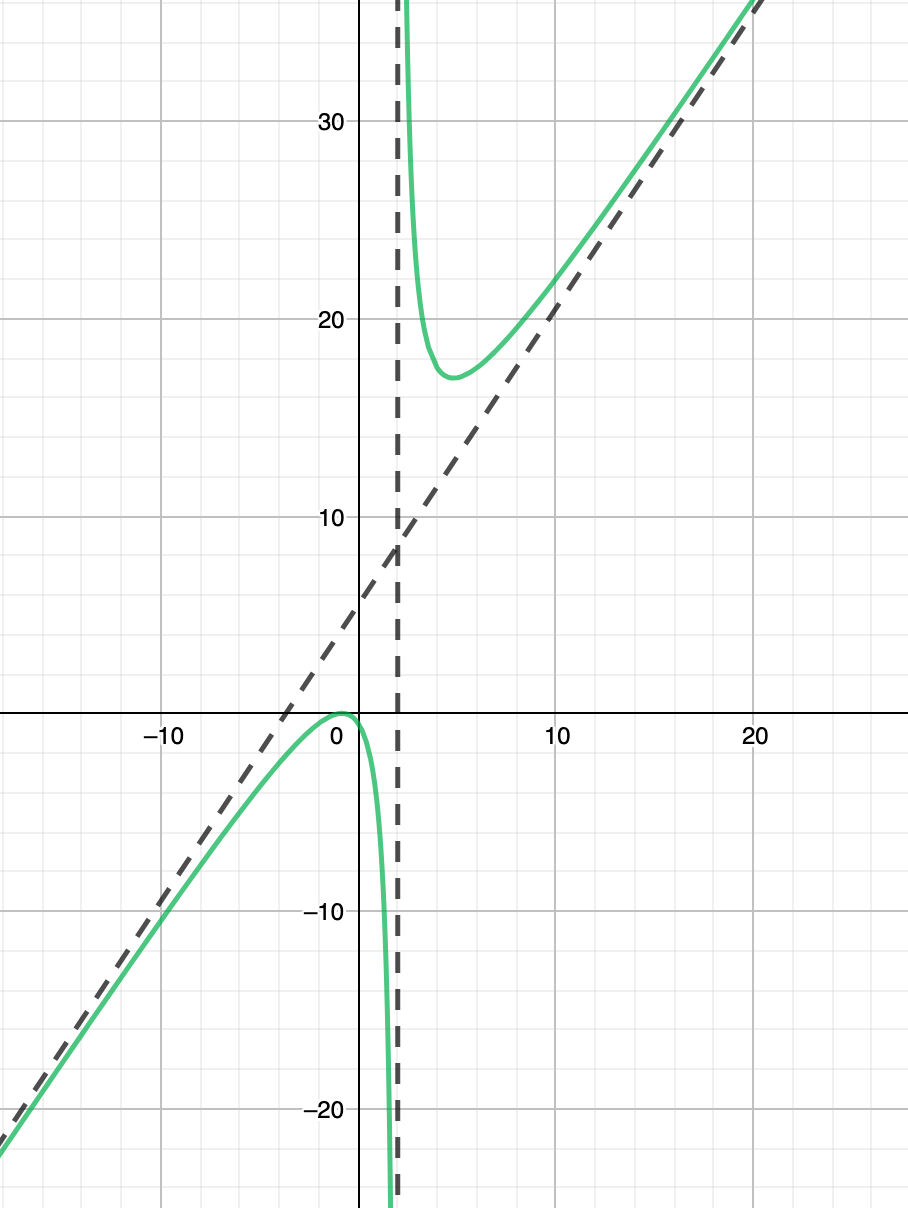
Domain:
Practice: Graphing Rational Functions
A rational function has the following properties:
- A horizontal asymptote at .
- Vertical asymptotes at .
- An x-intercept at
Which rational function best describes the above properties?
Practice: Graphing Rational Functions
Sketch a graph of , stating all asymptotes, x-intercepts, missing points, and positive & negative intervals.
Practice: Graphing Rational Functions
Find a rational function of the form that describes the following:
- Vertical asymptote at
- Horizontal asymptote at
- X-intercept at
Practice: Graphing Rational Functions
Write a rational function with the following properties:
- An oblique asymptote at
- A vertical asymptote at
- One of the x-intercepts is at