Popular Courses
ECON 203
Concordia University
Macroeconomics
University Study Guides
Macroeconomics
General Course
ECON 102
University of British Columbia
ECON 1100
University of Guelph
Macroeconomics
University Study Guides
ECON 102
University of Alberta
ECO102H1
University of Toronto
ECO 1102
University of Ottawa
ECON 209
McGill University
ECON 1BB3
McMaster University
ECON 112
Queen's University
ECON 1010
York University
ECON 295
McGill University
ECON 110B
Queen's University
ECON 105
Simon Fraser University
ECON 1102
Dalhousie University
ECON 1002
Carleton University
ECON 1BA3
McMaster University
ECON 330
McGill University
0:00 / 0:00
Employment
Types of Unemployment
- Frictional unemployment occurs due to turnover and job changes.
- Structural unemployment happens when there is a mismatch between labor force characteristics and available jobs.
- Full employment is when only frictional and structural unemployment exist.
- Cyclical unemployment fluctuates with the business cycle.
- Unemployment can also have seasonal fluctuations.
- Statistics Canada adjusts unemployment statistics to remove seasonal variations.
- All unemployment data presented in this class are seasonally adjusted.
- Natural Rate of Unemployment (NAIRU): unemployment rate caused only by frictional and structural unemployment.
- Non-accelerating inflation rate of unemployment
Frictional Unemployment
- Caused by normal turnover of labour.
- People leaving their jobs to find new ones.
- Or people entering the workforce and looking for jobs.
Structural Unemployment
- A mismatch between the supply of labour (workers) and the demand for labour (firms).
- Employee skills don't match the skills needed for the available jobs.
- Structural unemployment is caused by:
- The pace of economic change
- Policies that inhibit change
- Example: employment insurance
Wages
Changes in wages are influenced by the output gap and expectations of future inflation.
Output Gaps
- The output gap affects wages by exerting upward pressure during an inflationary gap and downward pressure during a recessionary gap.
- When Y > Y* , there is an inflationary gap, and wages tend to rise.
- When Y < Y*, there is a recessionary gap, and wages tend to fall.
- The absence of an inflationary or recessionary gap (Y = Y*) indicates no pressure on nominal wages.
- The non-accelerating inflation rate of unemployment (NAIRU) represents the natural rate of unemployment.
- We use the symbol U* for the NAIRU and U for actual unemployment
- The NAIRU is not zero and accounts for frictional and structural unemployment even when Y = Y*.
- When Y = Y*, U = U*
- When Y > Y*, U < U*
- When Y < Y *, U > U*
Expected Inflation
- Expectations of future inflation create pressure for nominal wages to rise.
- The higher the expected future inflation, the more workers will push to increase their wages.
The Phillips Curve
- Shows the relationship between wages (inflation) and unemployment.
Prices
- Changes in wages affect the Aggregate Supply (AS) curve, leading to shifts in the price level.
- If wages increase, AS shifts up (to the left) (inflationary)
- If wages decrease, AS shifts down (to the right) (disinflationary)
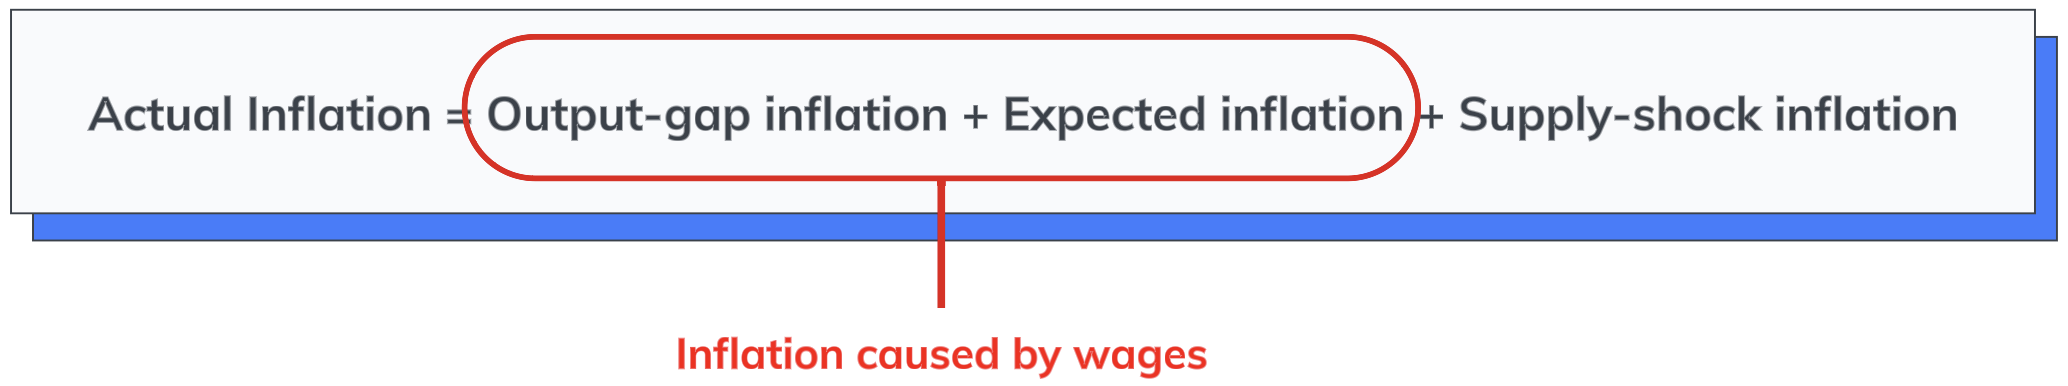
- Output Gap inflation: Inflation increase or decrease caused by the output gap.
- Expected inflation: The anticipated rate of inflation in the future, as perceived by consumers, businesses, and investors.
- Sometimes called the expectational effect
- Supply-shock inflation: Change in price levels due to an unforeseen shift in AS.
Constant Inflation
- In constant inflation equilibrium, there is no output-gap effect on wages and no supply-shock inflation, and nominal wages rise exactly at the expected rate of inflation.
- Actual inflation = Expected inflation
- Actual GDP = Real GDP
- Constant inflation is maintained through a balance of monetary expansion (MS increases so AD shifts right) and rising prices, which stabilize interest rates.
- AS and AD both shift equally and maintain the equilibrium real GDP.
Practice Questions: Wages, Unemployment and Inflation
1. Suppose economists were able to measure frictional unemployment as 2%, cyclical unemployment as 0%, and structural unemployment as 3%. Then we would know that the NAIRU is ________ and the actual unemployment rate is ________.
A) 0%; 5%
B) 5%; 5%
C) 0%; 3%
D) 5%; 0%
E) 2%; 5%
2. If the unemployment rate is greater than the NAIRU,
A) there will be upward pressure on wages.
B) the AS curve will shift upward.
C) there is a negative output gap.
D) real national income is above potential GDP.
E) there is an inflationary gap.
3. If the NAIRU is 8% and the actual unemployment rate is 5%,
A) there is no pressure on the AS curve to shift.
B) there is a recessionary gap.
C) demand forces put upward pressure on wages.
D) the AS curve will shift downward.
E) it will get stuck there permanently.
4. Suppose the NAIRU for Canada is 6.5%, and the actual unemployment rate is 5%. If the Bank of Canada reduces its target for the overnight interest rate,
A) it will move real GDP back toward potential GDP.
B) it will worsen the existing inflationary gap.
C) it will increase the unemployment rate.
D) the AD curve will shift to the left.
E) the AS curve will shift upward.
5. Actual inflation would be 2% when expected future inflation is ________, output-gap inflation is ________, and supply-shock inflation is ________.
A) 2%; 2%; 2%
B) 2%; 0%; -2%
C) 2%; 0%; 0%
D) 1%; 1%; 1%
E) 0%; 0%; -2%
6. Consider the AD/AS model with a constant rate of inflation. In this case,
A) there is no effective set of monetary policy tools to reduce inflation.
B) there is a tendency for the price of bonds to be increasing rapidly.
C) the AS curve is shifting upward because of inflation expectations.
D) expected inflation tends to be significantly less than actual inflation.
E) the AD curve is not shifting at all.
7. Canada's actual rate of inflation is fairly constant around the 2% level. We can conclude that
A) real GDP must be below potential GDP because we also have positive unemployment.
B) real GDP must be above potential GDP.
C) the Bank of Canada is accommodating this level of inflation with increases in the money supply.
D) the expectations about inflation are consistently wrong.
E) the economy is consistently experiencing an inflationary gap.
Practice Questions: Inflation
1. In which of the following cases would the actual unemployment rate be less than the NAIRU; that is, U < U*?
1) frictional unemployment = 2%; structural unemployment = 4%; cyclical unemployment = 4%
2) frictional unemployment = 3%; structural unemployment = 3%; cyclical unemployment = -2%
3) frictional unemployment = 2%; structural unemployment = 4%; cyclical unemployment = 0%
A) 1 only
B) 2 only
C) 3 only
D) 2 and 3 only
E) 1 and 2 only
2. Suppose economists were able to measure frictional unemployment as 3%, cyclical unemployment as 2%, and structural unemployment as 4%. Then we would know that
A) Y is below Y* and there is downward pressure on wages.
B) Y is below Y* and there is upward pressure on wages.
C) Y is equal to Y* and there is no pressure on wages.
D) Y is above Y* and there is downward pressure on wages.
E) Y is above Y* and there is upward pressure on wages.
3. Suppose the NAIRU for Canada is 6.5%, the actual unemployment rate is 5% and productivity is constant. We can conclude that
A) there is a recessionary gap.
B) the NAIRU will re-adjust to 5%.
C) the AD curve will automatically shift up.
D) the excess demand for labour will put upward pressure on wages.
E) the excess supply of labour will put downward pressure on wages.
4. Which of the following is consistent with constant inflation of 2%: expected future inflation of ________, output-gap inflation of ________, and supply-shock inflation ________.
A) 2%; 2%; 2%
B) 2%; 0%; -2%
C) 2%; 0%; 0%
D) 0%; 1%; 1%
E) 0%; 0%; 2%
Consider the AD/AS model below with a constant rate of inflation. No exogenous AD or AS shocks are occurring.

5. Suppose the constant rate of inflation is 3%. In this case,
A) equilibrium GDP and the price level are each increasing at a constant rate of 3% per year.
B) the AS curve is shifting upward by 3% per year and the AD curve remains stationary.
C) the AD curve is shifting upward by 3% per year and the AS curve remains stationary.
D) an annual shift upward of each of the AS and AD curves by 1.5% leads to a constant rate of inflation of 3%.
E) an annual shift upward of the AS curve by 3% is matched by an annual shift upward of the AD curve by 3%.
6. A constant rate of inflation of 3% is portrayed in an AD/AS diagram like this one as
A) an annual shift upward of the AD curve by 3%.
B) an annual shift upward of the AS curve by 3%.
C) an annual increase in the inflation rate of 3%.
D) an annual increase in the equilibrium price level of 3%.
E) Not applicable. The diagram shows the price level, not the inflation rate.