Wize University Physics Textbook (Master) > Waves: Mechanical
Snapshots and History Plots
Popular Courses
Intro to Physics
University Study Guides
Physics
General Course
PHYS 157
University of British Columbia
PHYSICS 1A03
McMaster University
PHYS 130
University of Alberta
PHYS 131
University of British Columbia
PHYS*1300
University of Guelph
Intro to Physics
University Study Guides
PHYS 124
University of Alberta
APSC 112
Queen's University
PHYSICS 1402A/B
Western University
LE/PHYS 1800 3.00
York University
PHYS 142
McGill University
ENGG 212
University of Calgary
PHYS 111
University of Victoria
PHYS 1050
University of Manitoba
PHYS 101
Simon Fraser University
PHYS-1300
University of Windsor
PHY 1121
University of Ottawa
PHYS 121
University of Waterloo
Snapshots and History Plots
Since traveling waves are functions of two variables, position and time , we can better analyze their behavior if we "freeze" one of the variables, and see what happens when the other one varies.
- The pattern for the oscillation of a single particle of the rope in time is known as the history plot (wave displacement at a specific )
- The spatial shape of the wave at any instant has a repetitive pattern. This is known as the snapshot of the wave (wave displacement at a specific )
Example: History Plot
Looking at the behavior of the string at , we graph the following behavior ( is measured in cm, is measured in seconds):
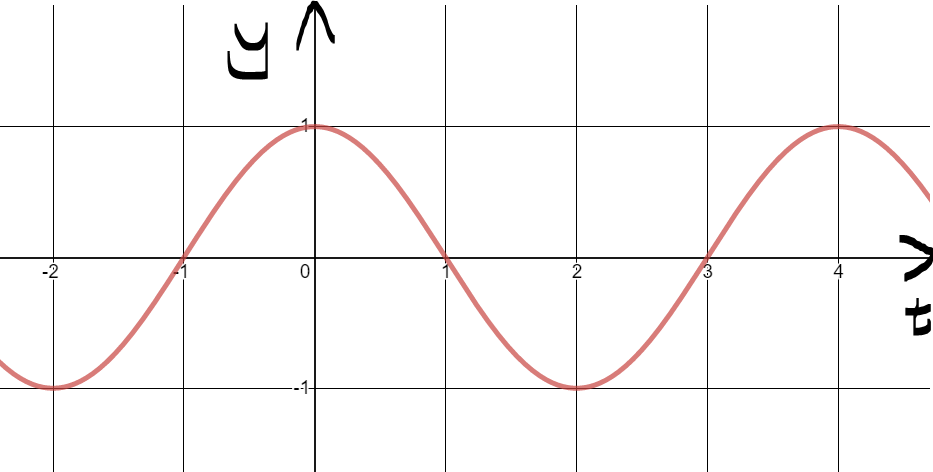
What is the wave's speed of propagation?
A) cm/s
B) cm/s
C) cm/s
D) cm/s
E) Not enough information
To find the speed of propagation of wave, we need a pair of quantities: or .
From this one graph, we can find the period:
and angular frequency:
But we cannot find the wave number nor the wavelength
Therefore, we do not have enough information to find the speed of propagation: answer is E).
Watch Out!
One might be tempted to construct the velocity from this graph, but this is the particle velocity, and NOT the speed of propagation.

Mark Yourself Question
- Grab a piece of paper and try this problem yourself.
- When you're done, check the "I have answered this question" box below.
- View the solution and report whether you got it right or wrong.
Practice: Snapshot and History Plots
The history and snapshot plots of a wave traveling in the direction of positive follow.
Write the displacement equation of the wave. Draw the snapshot plot s after .
