Wize University Statistics Textbook > Inference for Linear Regression
Confidence Intervals for Regression
Popular Courses
COMM 214
Concordia University
AP Statistics Exam Prep Course
AP Exam Prep
Statistics
General Course
Intro to Statistics
University Study Guides
COMM 215
Concordia University
COMM 191
University of British Columbia
STA 100
University of California - Davis
STATS 2244A/B
Western University
Intro to Statistics
University Study Guides
STATS 2035
Western University
QMS 210
Toronto Metropolitan University
STAT 263
Queen's University
MGCR 271
McGill University
STAT 251
University of British Columbia
STATS 2B03
McMaster University
STAT 217
University of Calgary
COMM 162
Queen's University
MGTSC 212
University of Alberta
STAT 1060
Dalhousie University
ECON 227
McGill University

0:00 / 0:00
Confidence Interval for Linear Regression
The slope of the population line is the most important parameter in regression. The slope measures the change of for every addition one unit increase in .
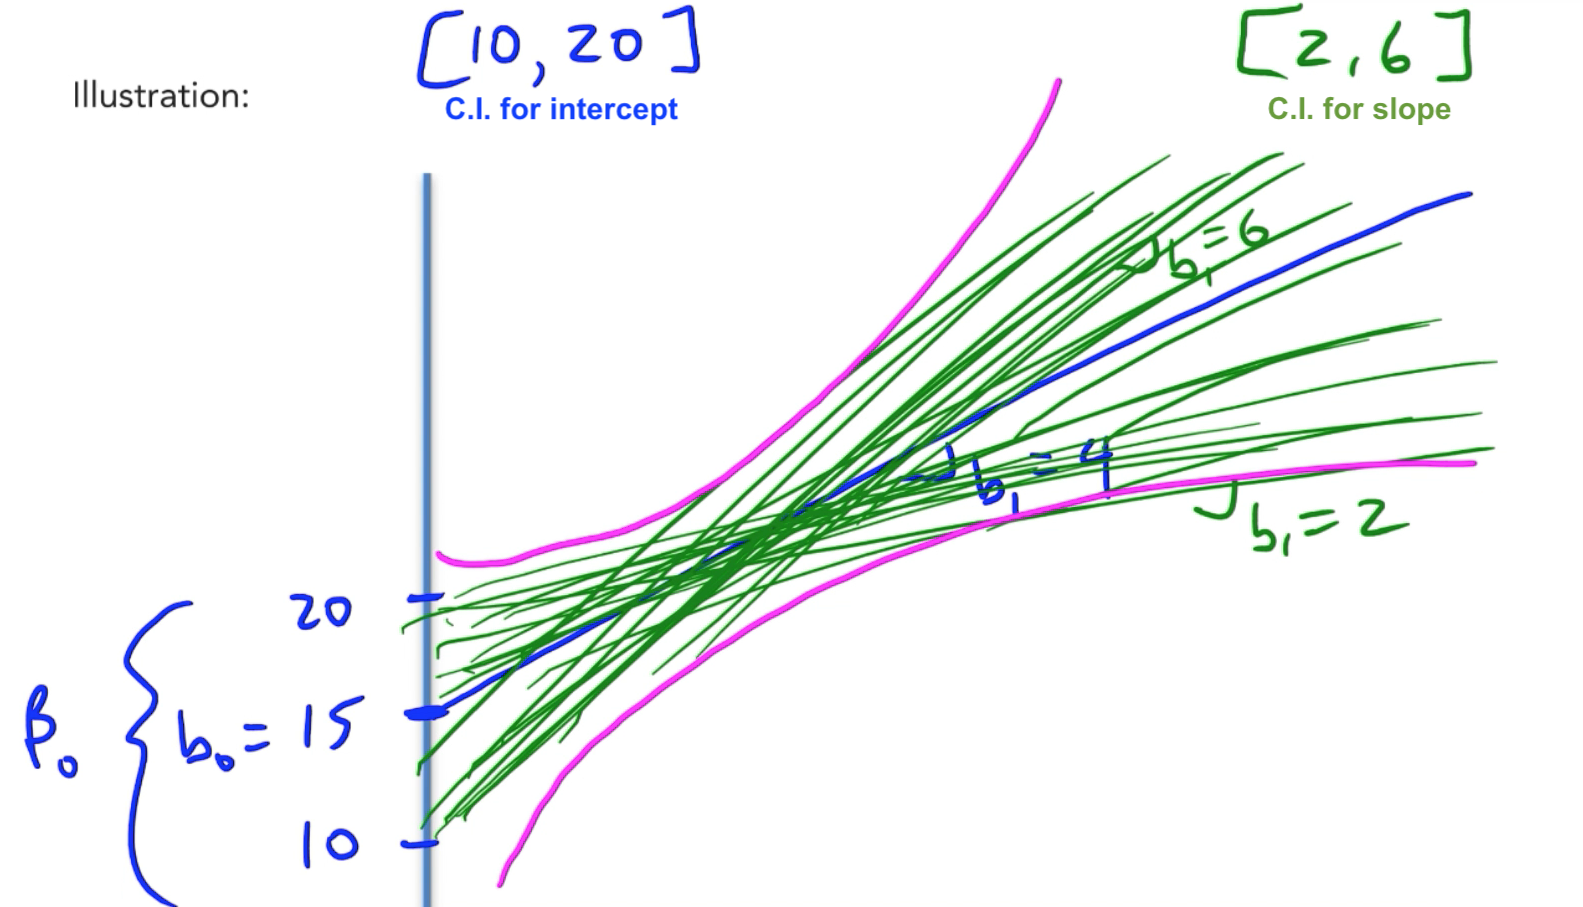
The population slope is the parameter we are trying to estimate using the sample slope , which is the statistic or point estimate.
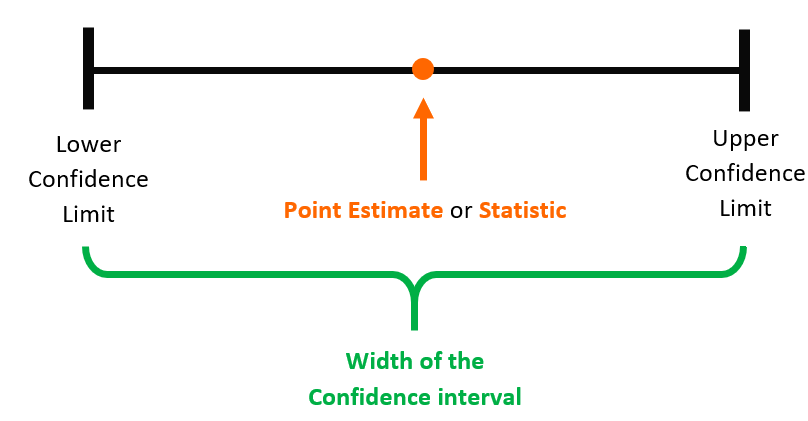
A confidence interval is a range of values, based on the sample data, that is used to estimate an unknown population parameter – in this case, the population mean – at a given confidence level – usually 90%, 95%, or 99%.
Formulas

Example

0:00 / 0:00
Example: Confidence Interval for Regression
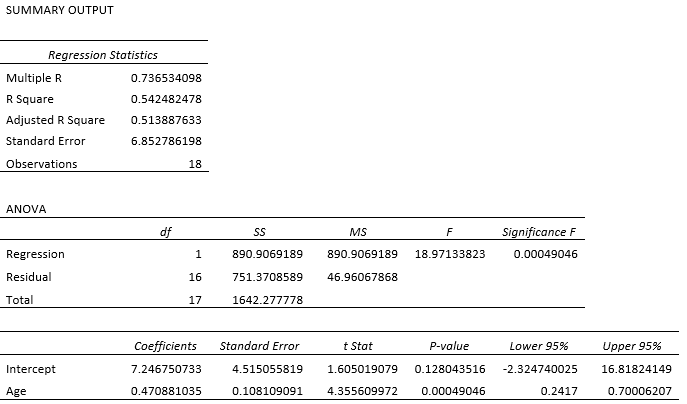
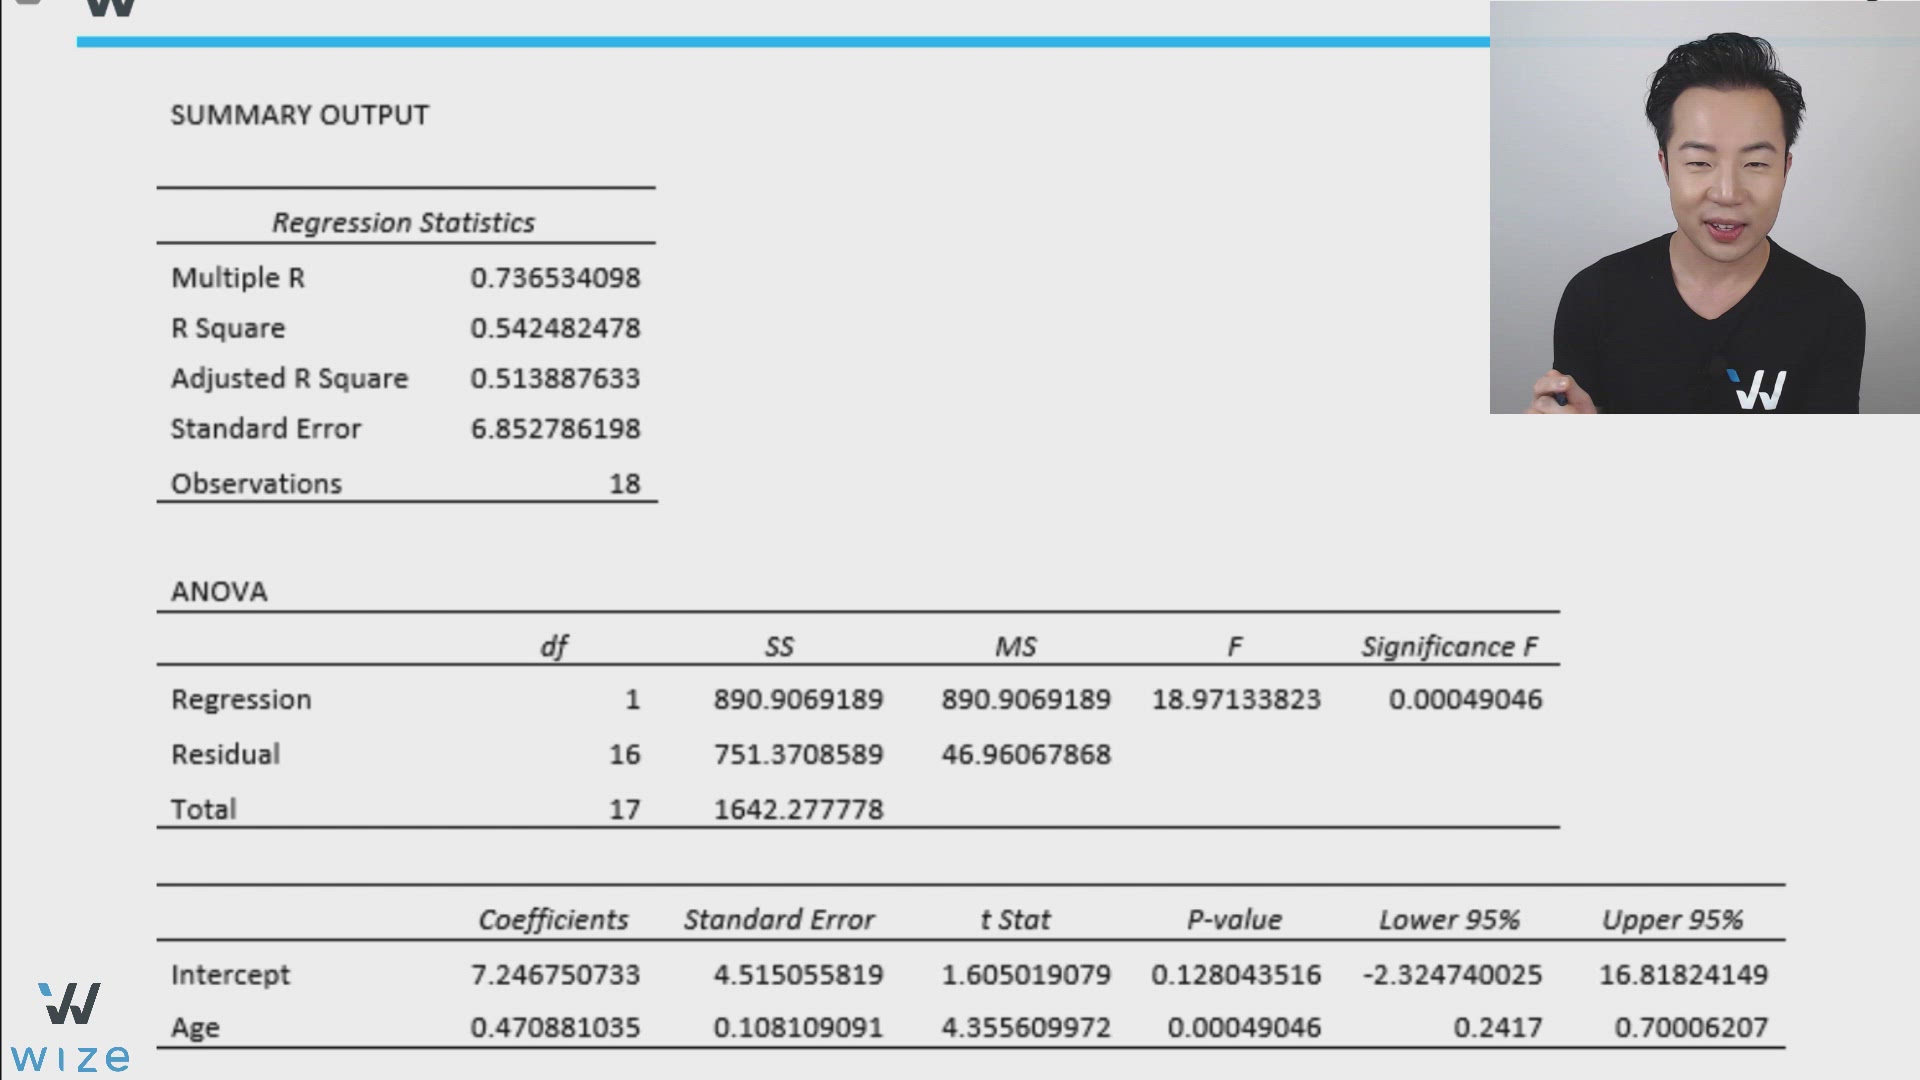
(a) Construct a 95% confidence interval for the true unknown population intercept.
[Use t-table to find this value.]
We are 95% confident that the true population intercept is in that interval.

(b) Construct a 95% confidence interval for the true unknown population slope .
We are 95% confident that the true population slope is in that interval.
You can see the confidence intervals for both intercept and slope at the bottom right part of the ANOVA table.

There are 42 observations for this linear regression model to estimate a movie's rating () based on its box office gross earnings ().
Construct a 95% confidence interval to estimate the population slope .
0:00 / 0:00
Slope: The Significance of "Zero" (or Lack Thereof)
In statistics, we often hear the phrase "statistically significantly different from zero".
What happens if the confidence interval for the intercept contains “0”?
No problem. The intercept can be positive or negative.
What happens if the confidence interval for the slope contains “0”?
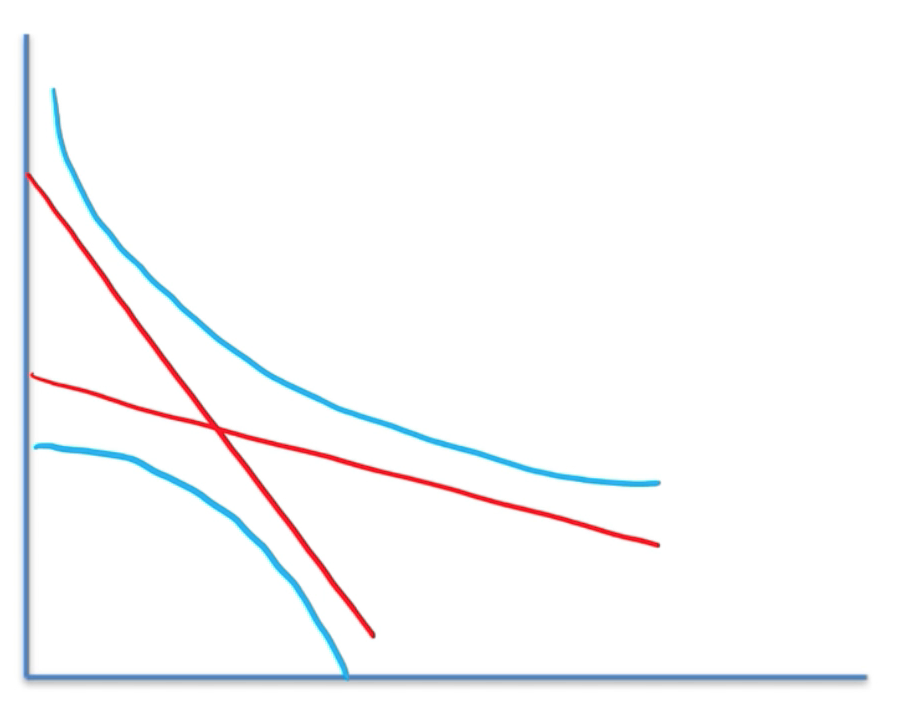
Since the confidence interval contains “0”, that means it is possible for the slope of the regression line to be zero!
- When the slope , that means does not change when changes.
- This means there is no significant (linear) relationship between and .
- Thus, we cannot express it as a linear function.
Wize Concept
When the confidence interval for the slope does not contain “0”, it means that the slope is statistically significantly different from zero.
This means there is a significant (linear) relationship between and .
Example #1
Confidence Interval (Slope )

Example #2
Confidence Interval (Slope )
Example #3
Confidence Interval (Slope )

Practice: Confidence Interval for Slope with Zero
A linear regression model is used to estimate a person's net worth based on the number of cars they own. The confidence interval for the slope is . Which of the following is true?