Wize University Statistics Textbook > Multiple Regression
Multiple Regression Model
Popular Courses
COMM 214
Concordia University
Statistics
General Course
Intro to Statistics
University Study Guides
COMM 215
Concordia University
COMM 191
University of British Columbia
STA 100
University of California - Davis
Intro to Statistics
University Study Guides
STATS 2035
Western University
QMS 210
Toronto Metropolitan University
MGCR 271
McGill University
STATS 2B03
McMaster University
STAT 217
University of Calgary
COMM 162
Queen's University
MGTSC 212
University of Alberta
ECON 227
McGill University
STAT-2910
University of Windsor
Stats 8
Oregon State
STAT 1000
University of Manitoba
SC/MATH 2930 3.00
York University
STAT 252
University of Victoria

0:00 / 0:00
Multiple Regression

So far, for simple linear regression, we only used one explanatory variable to explain or predict one response variable . In reality, it may take more than one explanatory variable to explain .
Suppose we use the number of hours spent studying () to predict one’s grade () and we get this simple linear regression equation:
Given this linear regression model, . This means only 67% of grade is explained by the number of hours spent studying.
Where is the other 33%?
It is explained by other explanatory variables other than hours spent studying, such as IQ, GPA, and hours spent playing video games.
When more explanatory variables are added to a simple regression model to strengthen the ability to explain , the simple regression model is converted into a multiple regression model.
When we have multiple explanatory variables to explain y, we are using a multiple regression model:
# of explanatory variables,;
random error term. It represents everything that the model does not explain for y.
The estimated regression equation is:
To predict grade using a multiple regression line, it may look like this:
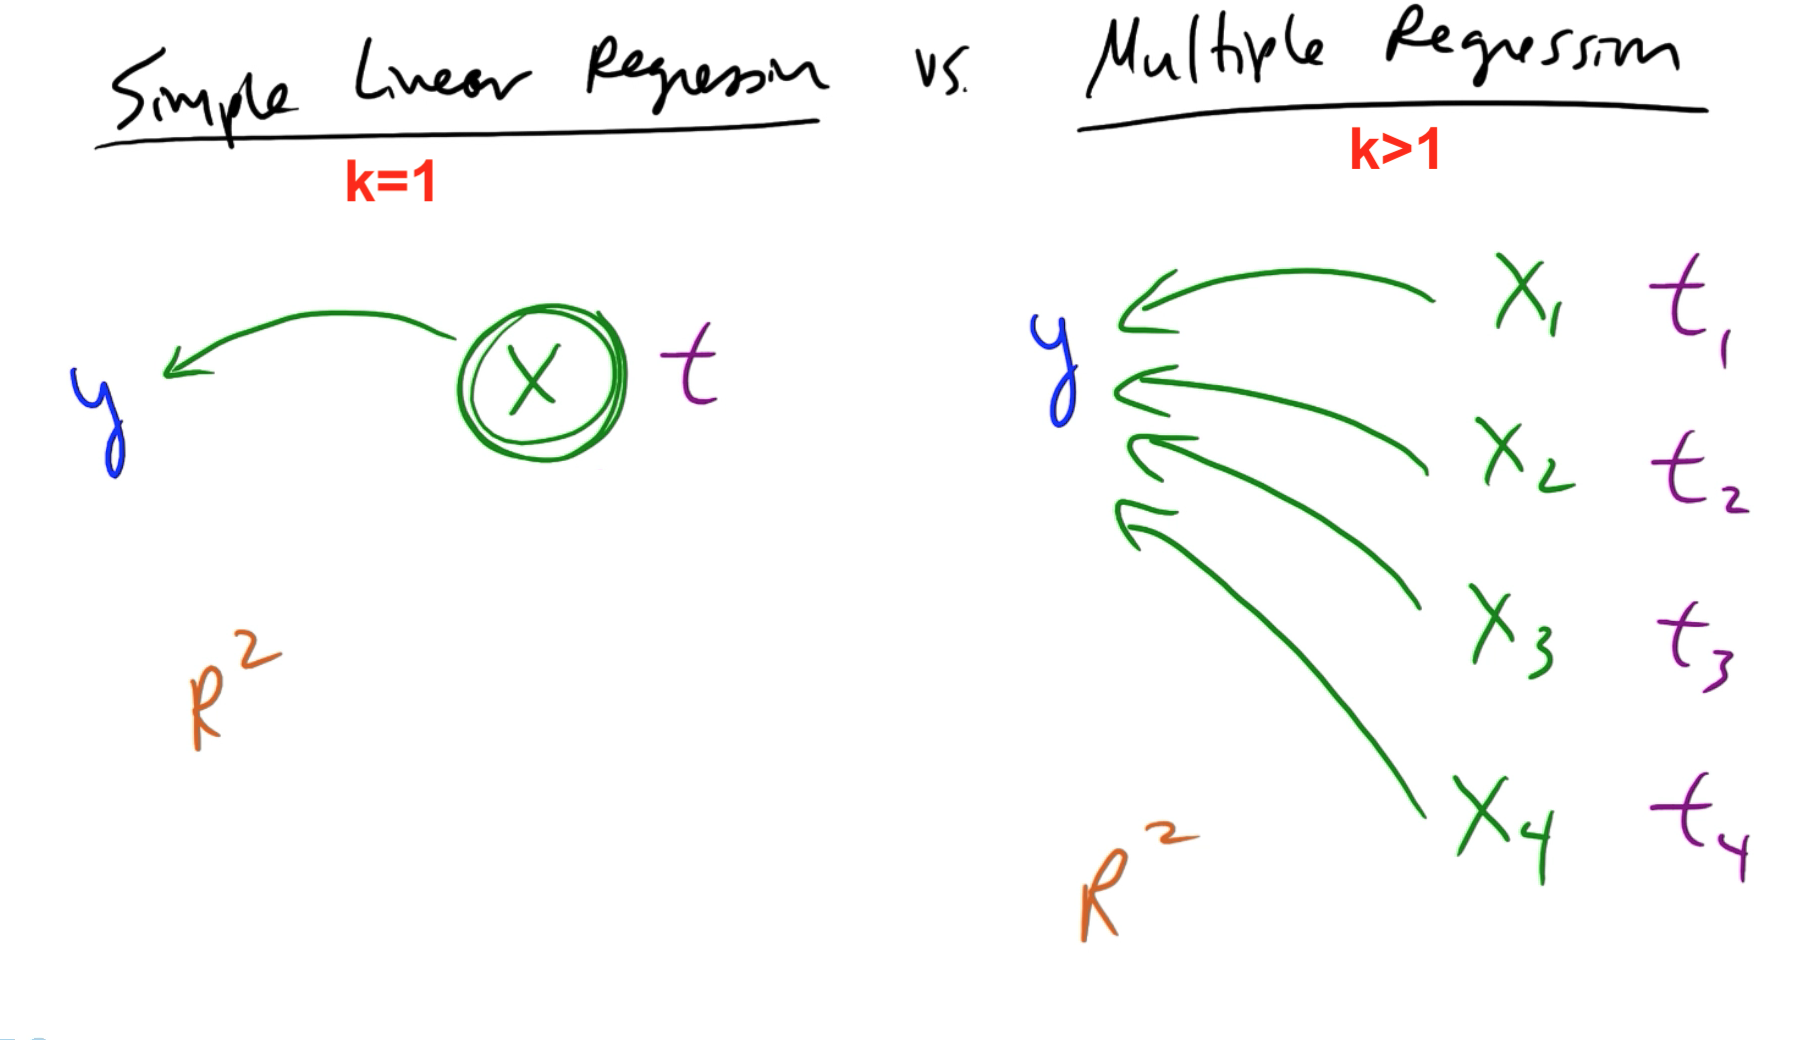
Simple Linear Regression vs. Multiple Regression
Simple Linear Regression
- : There is one explanatory variable to explain
- there is one t-score
- correlation can be used
- may be used
Multiple Regression
- : There are multiple explanatory variables to explain
- each explanatory variable has their own t-score
- correlation cannot be used
- may be used
- F-score
0:00 / 0:00
F-test for Multiple Regression
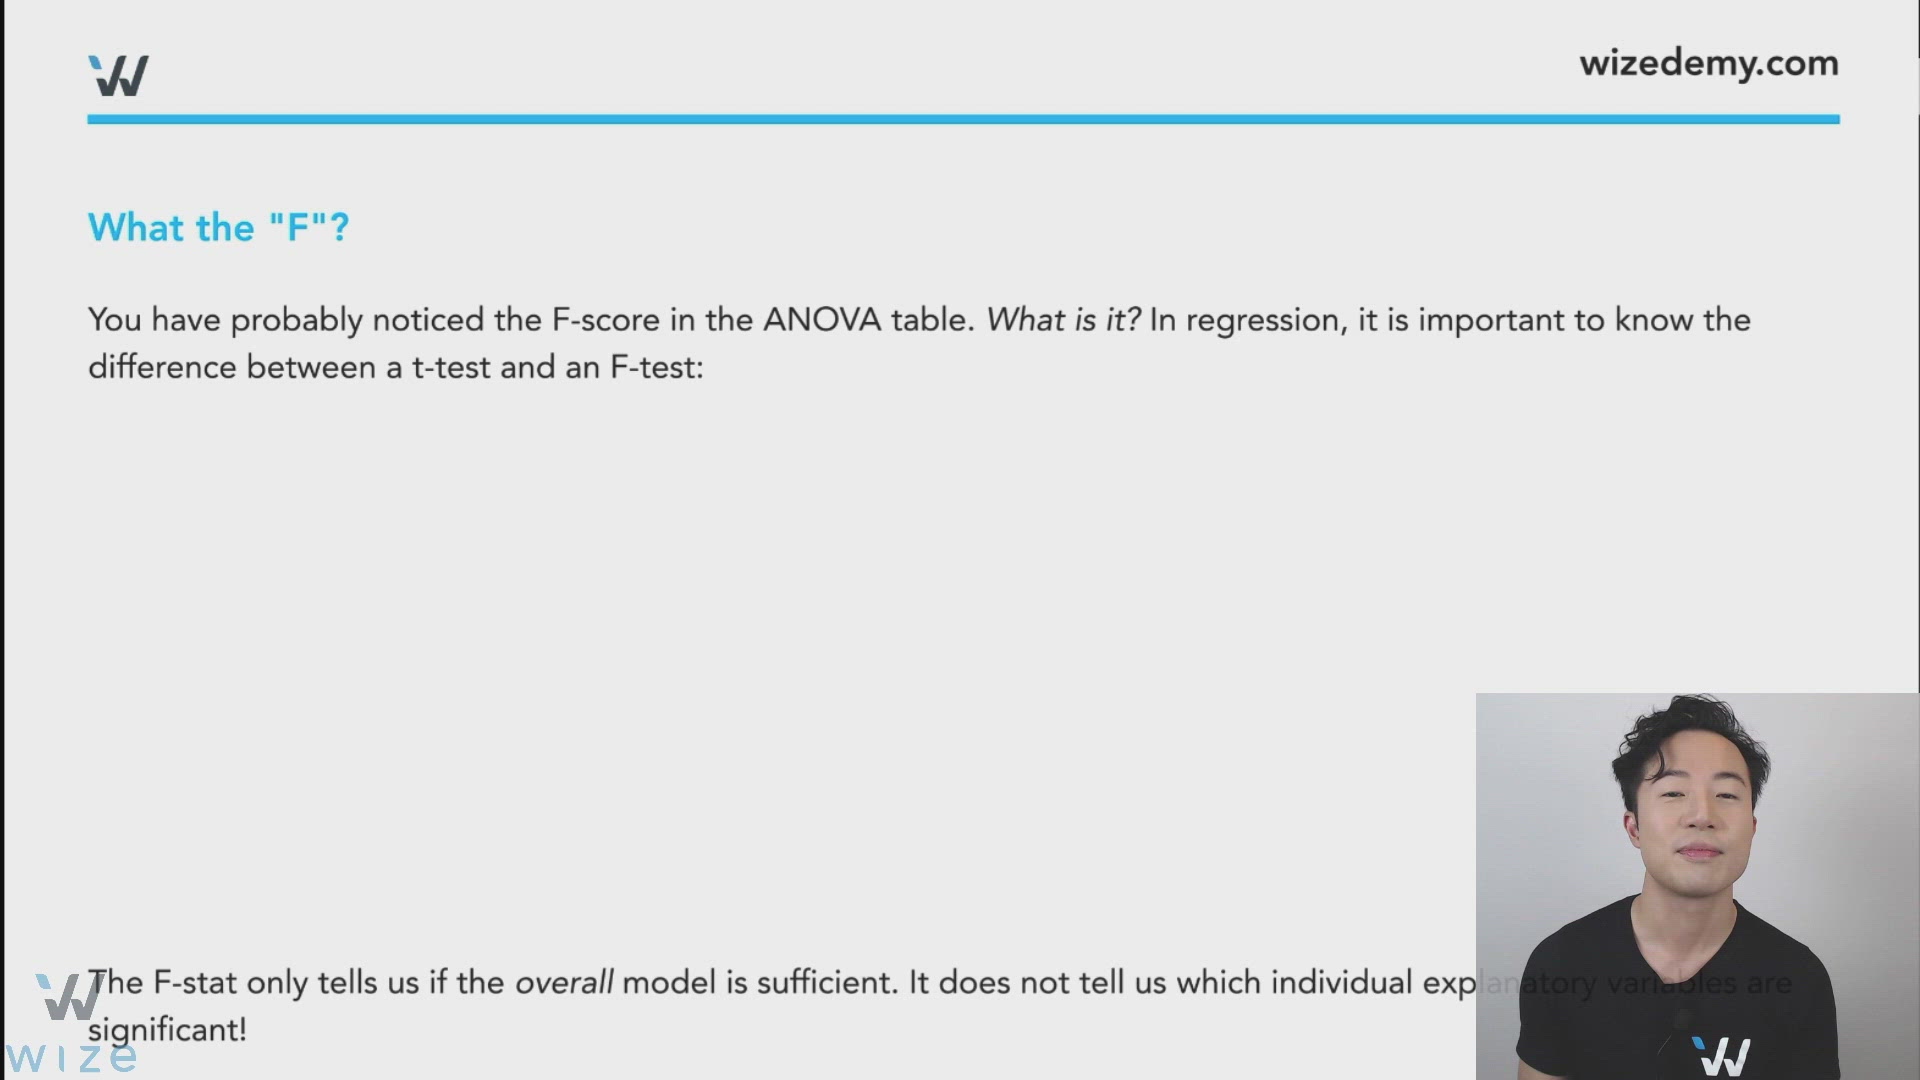
What the "F"?
You have probably noticed the F-score in the ANOVA table. What is it? In regression, it is important to know the difference between a t-test and an F-test.
- The F-stat only tells us if the overall model is sufficient. However, it does not tell us which individual explanatory variables are significant.
- Each explanatory variable will have its own t-score so you will be able to assess the significance of each one by running t-tests.
- There is only one F-score in a regression model.

0:00 / 0:00
Solving for the F-score
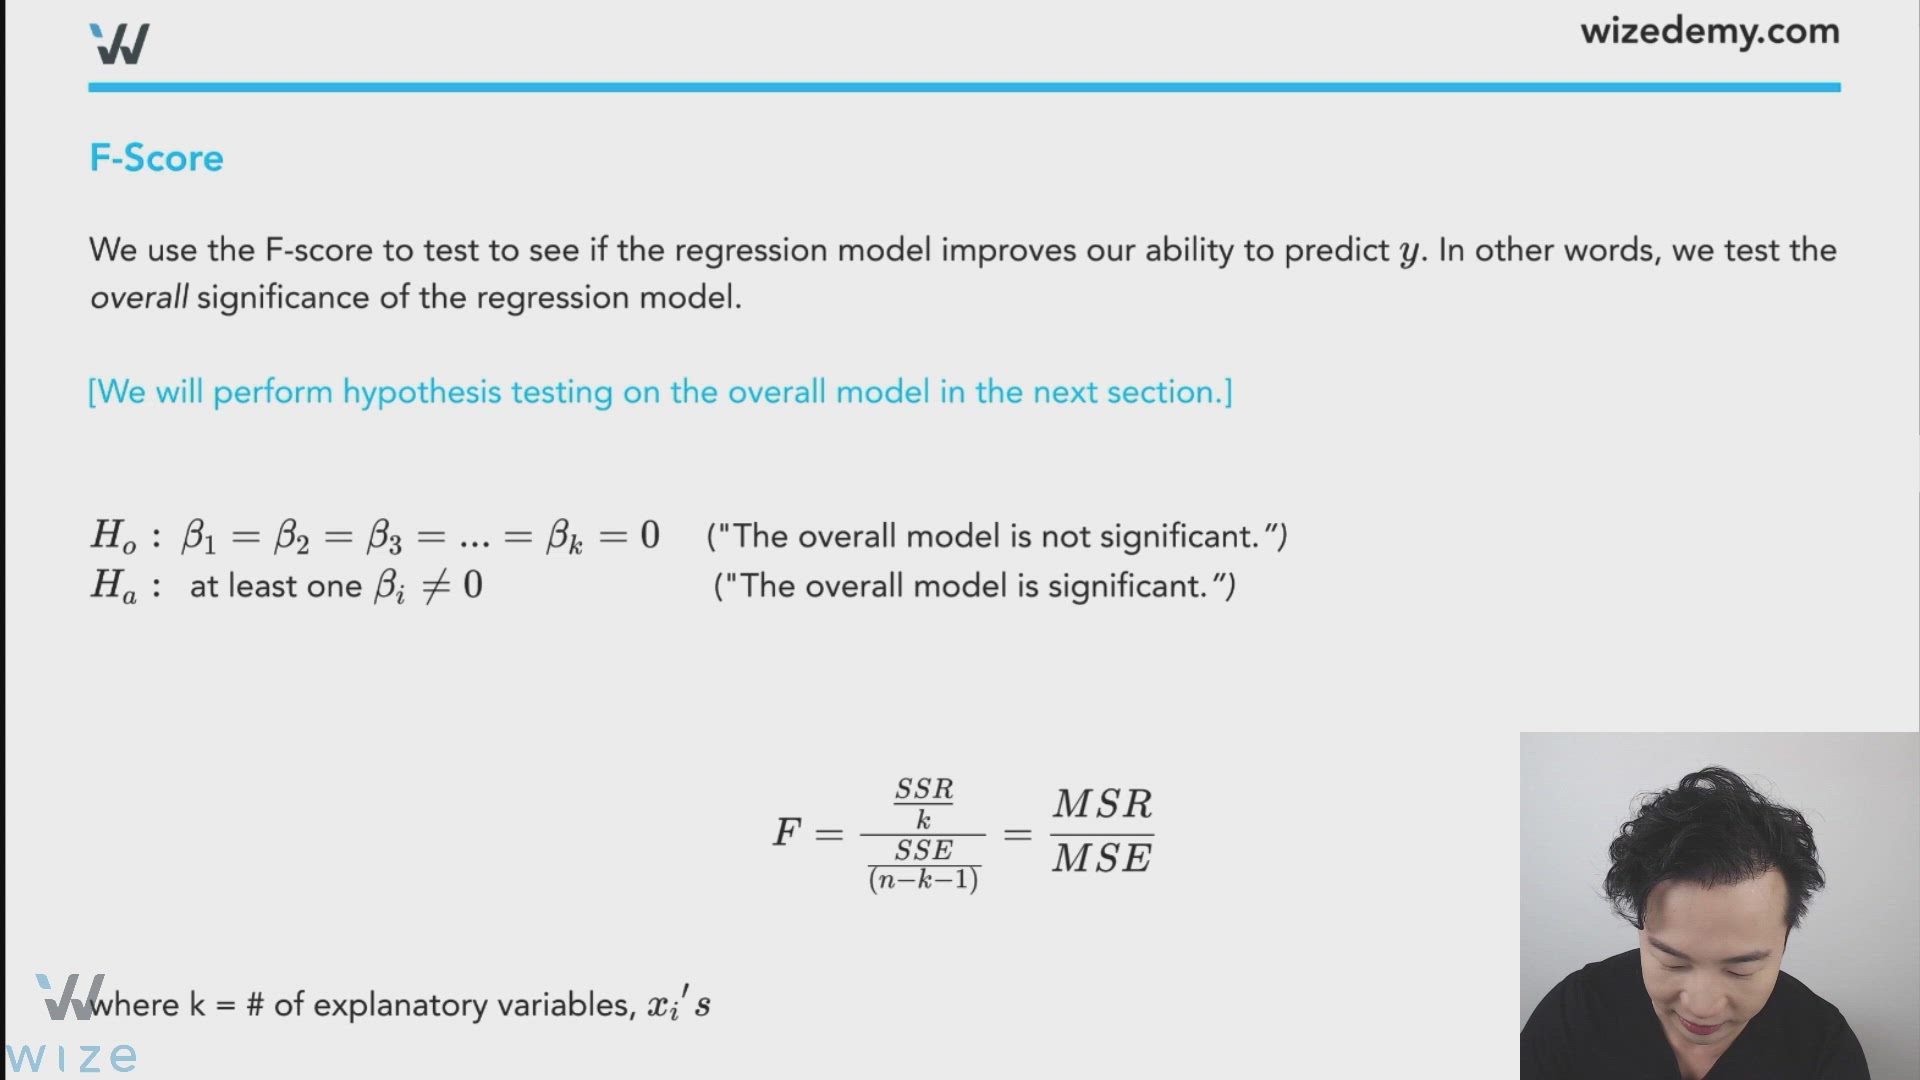
We use the F-score to test to see if the regression model improves our ability to predict . In other words, we test the overall significance of the regression model.
("The overall model is not significant.”)
at least one ("The overall model is significant.”)
"F" for "full" model
where,
- # of explanatory variables,
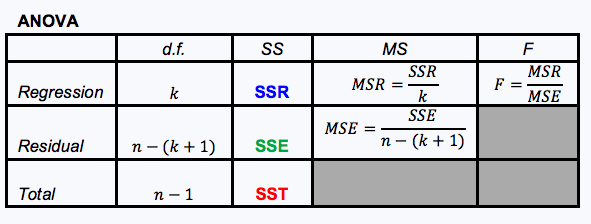
The F-test has two degrees of freedom:
- df numerator
- df denominator
Summary:
Example
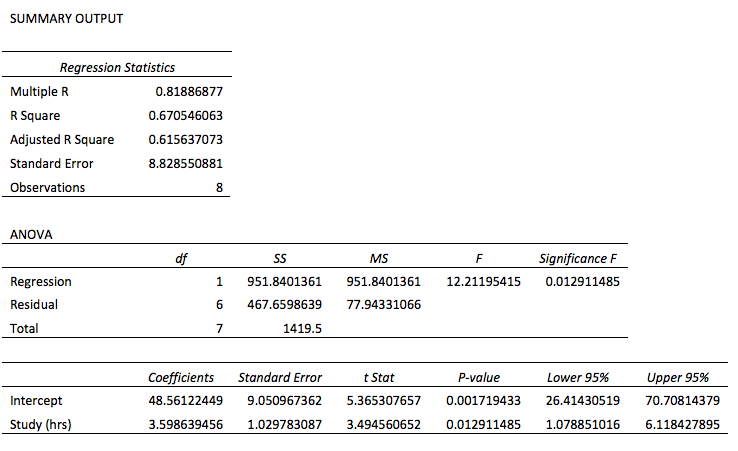
Determine the F-statistic:
The follow rules are only true in simple linear regression where is there is only one explanatory variable :
- p-value(F) = p-value(t)
0.0129 = 0.0129
Watch Out!
The above rules are only true if . This is not the case in multiple regression where .
0:00 / 0:00
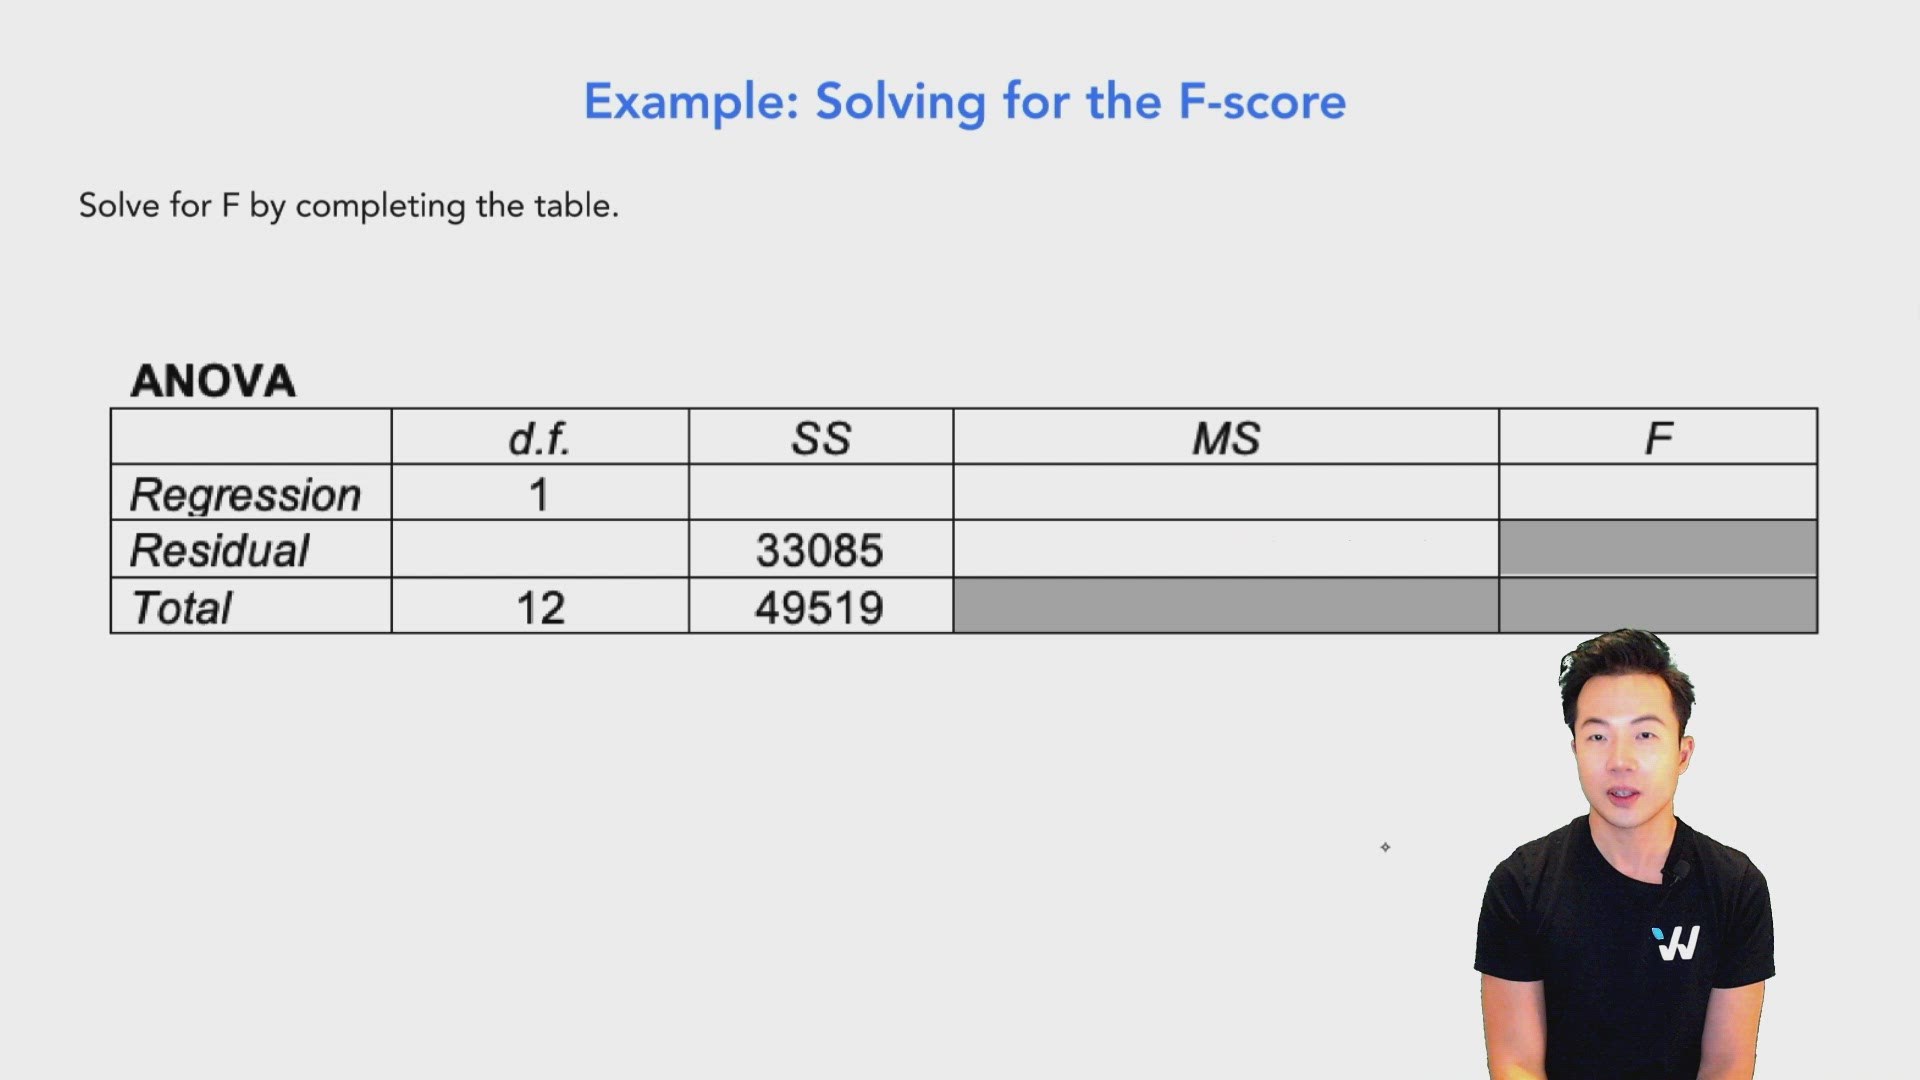
Example: Solving for the F-score
Solve for F by completing the table.

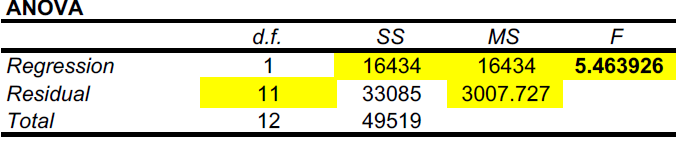
Therefore:
Don't overthink it:
(Regression df) + (Residual df) = Total
1+11 = 12
Solve for F using the clues provided.
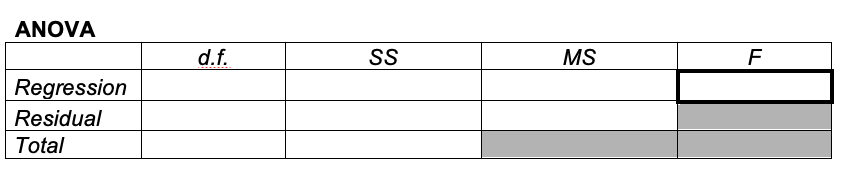
Try this on your own before looking at the video solution! Click on "Hint" for useful formulas.