Create a free account to get started

Unlock full course notes by signing up

  • Video lessons taught by top educators
  • Practice questions with guided solutions
  • Written review notes for reference
  • Expert answers anytime from course tutors

Hypothesis Testing for Linear Regression

We can assess the linear regression model to determine if there is a significant linear relationship between XX and YY. Specifically, we test the slope β1\beta_1.


If there is no linear relationship betweenXX and YY, then:

  • The regression line will be horizontal with the slope β1=0\beta_1=0.
  • That means YY does not change when XX changes.
  • There is no significant (linear) relationship between XX and YY .


As such, the hypotheses for testing the slope are:

Ho:β1=0H_o:\beta _1=0 There is no linear relationship.”

Ha:β1≠0H_a:\beta _1\neq0 There is a linear relationship.” →\rightarrownegative or positive (two-sided test)


Note: We almost always conduct two-sided tests when testing β1\beta_1 although it is not odd to ask the following:


“Is there a positive linear relationship?”


Ho:β1≤0H_o:\beta_1 \leq 0 “There is not a positive linear relationship.”

Ha:β1>0H_a:\beta_1 > 0 “There is a positive linear relationship.” (one-sided test)


“Is there a negative linear relationship?”


Ho:β1≥0H_o:\beta_1 \geq 0 “There is not a negative linear relationship.”

Ha:β1<0H_a:\beta_1 < 0 “There is a negative linear relationship.” (one-sided test)


Recap of t-table:


Image illustrating Hypothesis Testing for Linear Regression


T-Test for Slope

A regression model is useful when XX and YY have a statistically significant relationship that is either a positive or a negative relationship. In other words, we test if the β1\beta_1 coefficient is significantly different from zero.


To test the significance of the slope coefficient, we must perform a t-test:


Test statistic

t=b1SE(b1)\boxed{t=\frac{b_1}{SE\left(b_1\right)}}

where SE(b1)SE\left(b_1\right) the is standard error of the slope b1b_1:

SE(b1)=SeSSxx\boxed{SE\left(b_1\right)=\frac{S_e}{\sqrt{SS_{xx}}}}


Degrees of freedom

df=n−k−1df=n-k-1


df=n−(k+1)df=n-\left(k+1\right)


Create a free account to get started

Unlock full course notes by signing up

  • Video lessons taught by top educators
  • Practice questions with guided solutions
  • Written review notes for reference
  • Expert answers anytime from course tutors

Example: Hypothesis Testing for Linear Regression

We want to see if there is a relationship between how many hours a student studies the day before the exam and the exam grade. We randomly sampled 8 students.
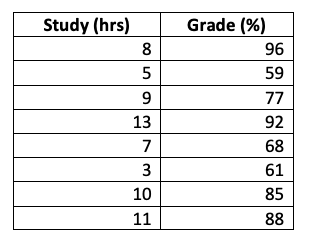

Image illustrating Example


(a) What is the explanatory variable?


Hours of study Grade


Hours of study

(b) What is the response variable?


Hours of study Grade

Grade


(c) Before we test the linear model for the relationship between grade and number of hours of studying, state the hypotheses.


Ho: β1=0\beta_1=0 "There is no linear relationship."

Ha: β1≠0\beta_1\neq0"There is a linear relationship"


(d) Is this a one-sided or two-sided test?


One-sided Two-sided

Two-tailed test


This is the output for the linear model:
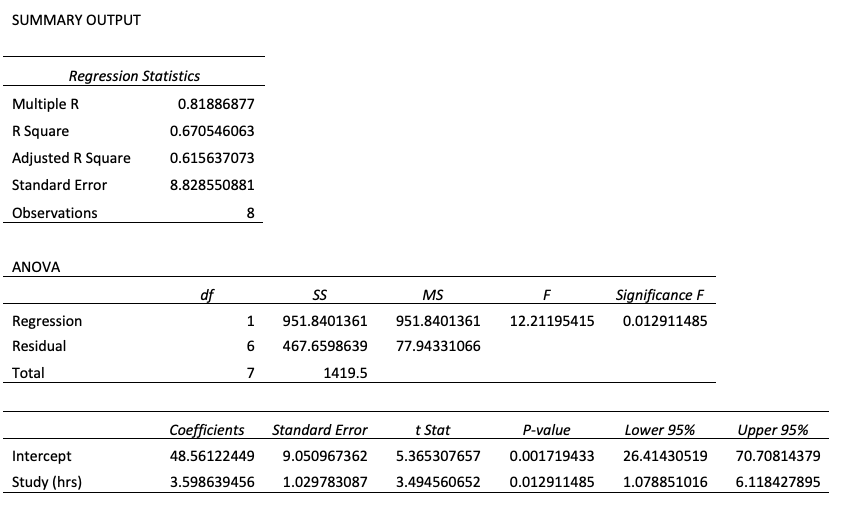


Image illustrating Example


(e) Write down the numeric values for the following:


bo=b_o= ________


b1=b_1= ________


SE(b1)=SE\left(b_1\right)= ________


(f) What is the simple linear regression equation?


y^=48.56+3.599x\hat y=48.56+3.599x

(g) Interpret the Hours coefficient.


Each additional hour of studying ________ grade by ________ percent, on average.


Each (one) hour of studying increases grade by 3.599 percent, on average.

(Do not just say that it is the slope!)


(h) What is the test statistic?


t=b1SE(b1)=3.598641.02978=3.495\displaystyle{t=\frac{b_1}{SE\left(b_1\right)}=\frac{3.59864}{1.02978}=3.495}


(i) What’s the df?


df=n−k−1=8−1−1=6df=n-k-1=8-1-1=6


(j) What is the p-value?

Using t-table: p-value is between 0.01 and 0.02.

Using software: p-value = 0.013


Image illustrating Example


(n) At the 5% significance level, is there evidence of a linear relationship between grade and hours of studying?


We reject/fail to reject Ho;H_o; we conclude that studying does/does not contain information that can be used to predict grade.


The p-value is less than α=0.05\alpha=0.05 We reject Ho and conclude that there is a linear relationship between grade and hours of studying.

Create a free account to get started

Unlock full course notes by signing up

  • Video lessons taught by top educators
  • Practice questions with guided solutions
  • Written review notes for reference
  • Expert answers anytime from course tutors

Example: Hypothesis Testing for Linear Regression (Sxy, Sxx, Syy Method)

Savage Question!

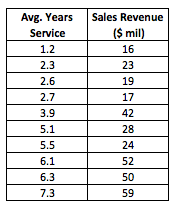
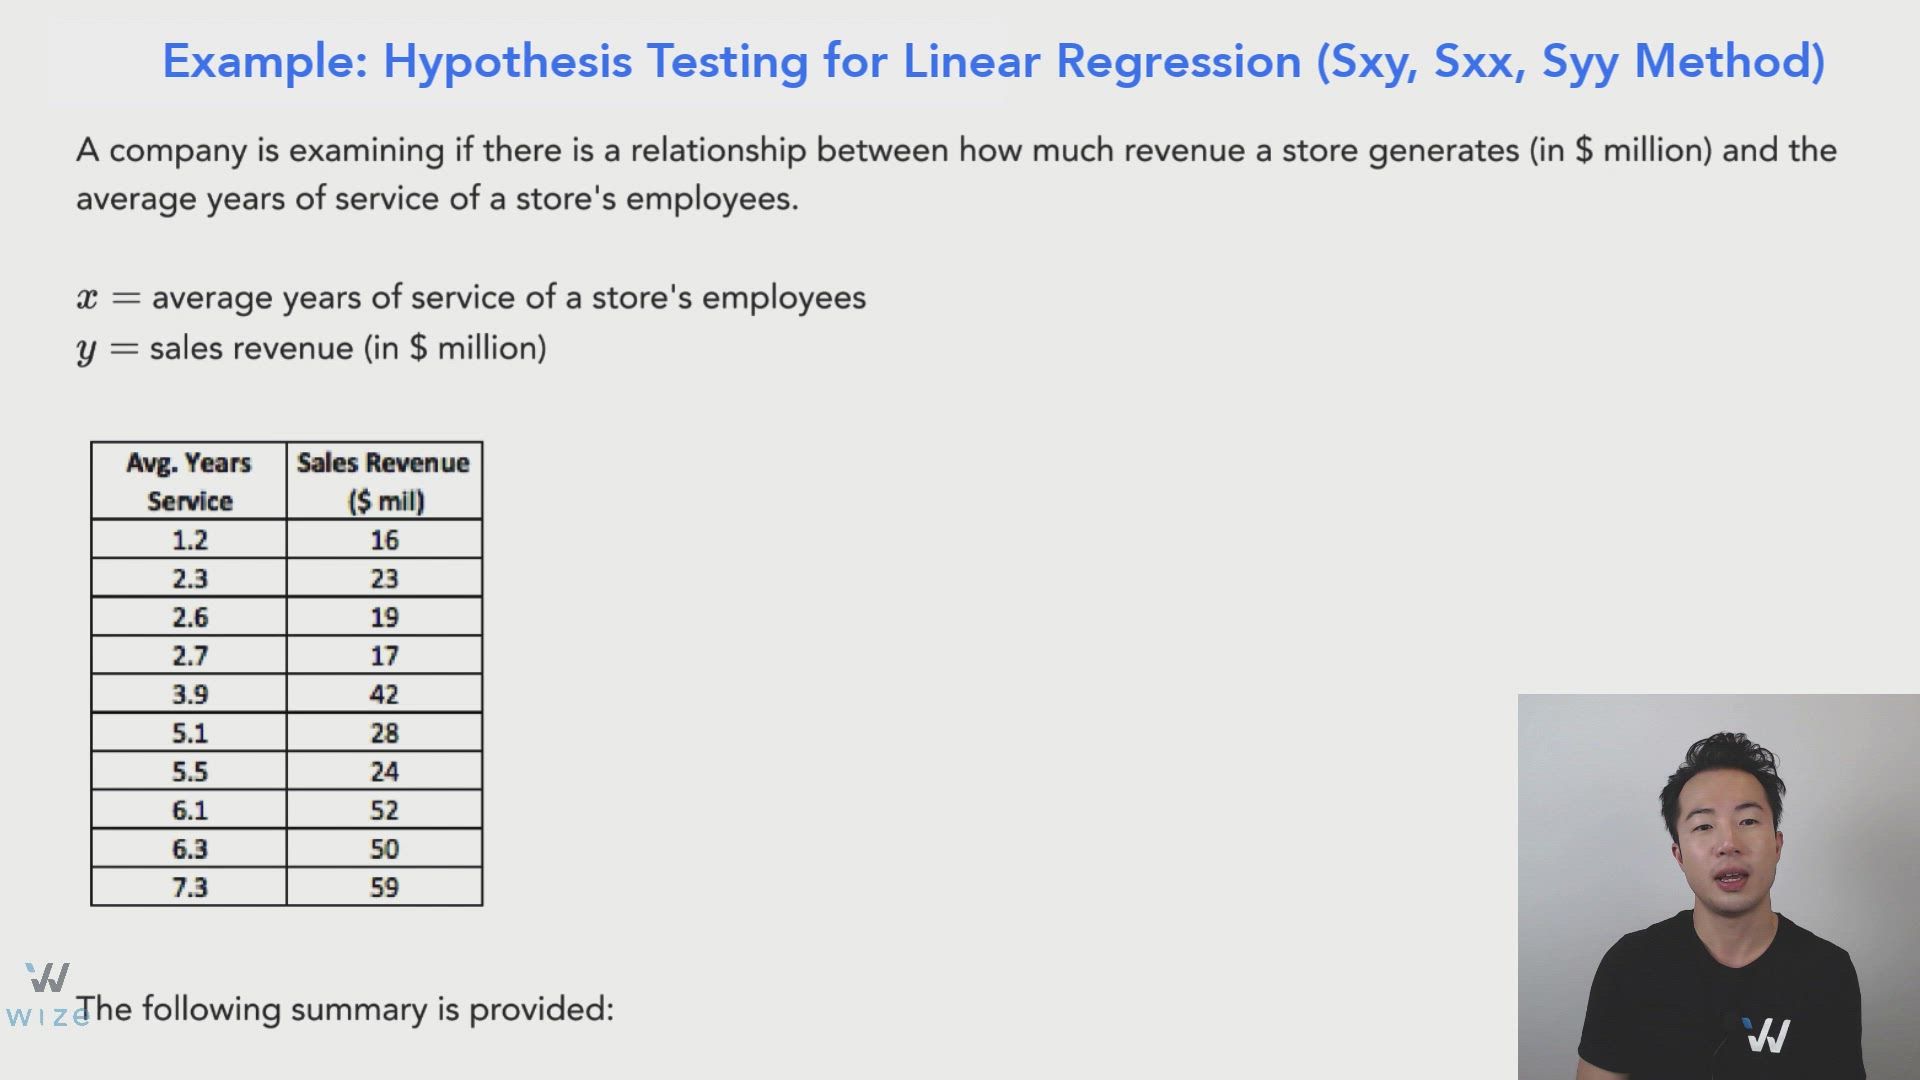
A company is examining if there is a relationship between how much revenue a store generates (in $ million) and the average years of service of a store's employees.


x=x= average years of service of a store's employees

y=y= sales revenue (in $ million)


Image illustrating Example


The following summary is provided:


∑x=43\sum_{ }^{ }x=43

∑x2=222.44\sum_{ }^{ }x^2=222.44

∑y=330\sum_{ }^{ }y=330

∑y2=13244\sum_{ }^{ }y^2=13244

∑xy=1669\sum_{ }^{ }xy=1669


At the 5% significance level, test for the significance of the linear relationship between xx and yy.

Ho:β1=0H_o:\beta _1=0 There is no linear relationship.”

Ha:β1≠0H_a:\beta _1\neq0 There is a linear relationship.”

Test statistic:

t=b1SE(b1)t=\frac{b_1}{SE\left(b_1\right)}

where SE(b1)SE\left(b_1\right) the is standard error of the slope b1b_1:

SE(b1)=SeSSxxSE\left(b_1\right)=\frac{S_e}{\sqrt{SS_{xx}}}


First, we need to solve for the slope coefficient b1b_1:


b1=SSxySSxx \displaystyle{b_1=\frac{SS_{xy}}{SS_{xx}}\ }


SSxy=∑xiyi−(∑xi)(∑yi)n\displaystyle{SS_{xy}=\sum_{ }^{ }x_iy_i-\frac{\left(\sum_{ }^{ }x_i\right)\left(\sum_{ }^{ }y_i\right)}{n}}


SSxy=1669−(43)(330)10=250\displaystyle{SS_{xy}=1669-\frac{\left(43\right)\left(330\right)}{10}=250}


SSxx=∑xi2−(∑xi)2n\displaystyle{SS_{xx}=\sum_{ }^{ }x_i^2-\frac{\left(\sum_{ }^{ }x_i\right)^2}{n}}


SSxx=222.44−(43)210=37.54\displaystyle{SS_{xx}=222.44-\frac{\left(43\right)^2}{10}=37.54}


b1=SSxySSxx=25037.54=6.66\displaystyle{b_1=\frac{SS_{xy}}{SS_{xx}}=\frac{250}{37.54}=6.66}


For SE(b1)SE\left(b_1\right), we need to find SeS_e:

SE(b1)=SeSSxxSE\left(b_1\right)=\frac{S_e}{\sqrt{SS_{xx}}}


se=SSEn−k−1\displaystyle{s_e=\sqrt{\frac{SSE}{n-k-1}}}


SeS_e requires SSESSE...


SSE=SSyy−(SSxy)2SSxx\displaystyle{SSE=SS_{yy}-\frac{(SS_{xy})^2}{SS_{xx}}}


SSE SSE\ requires SSxxSS_{xx}, SSyySS_{yy}, and SSxySS_{xy}...


We already have:


SSxx=37.54SS_{xx}=37.54

SSxy=250SS_{xy}=250


Find SSyySS_{yy}:


SSyy=∑yi2−(∑yi)2n\displaystyle{SS_{yy}=\sum_{ }^{ }y_i^2-\frac{\left(\sum_{ }^{ }y_i\right)^2}{n}}


SSyy=13244−(330)210=2354\displaystyle{SS_{yy}=13244-\frac{\left(330\right)^2}{10}=2354}


SSE=SSyy−SSxy2SSxx=2354−(250)237.54=690\displaystyle{SSE=SS_{yy}-\frac{SS_{xy}^2}{SS_{xx}}=2354-\frac{\left(250\right)^2}{37.54}=690}


Se=SSEn−k−1=69010−1−1=9.29\displaystyle{S_e=\sqrt{\frac{SSE}{n-k-1}}=\sqrt{\frac{690}{10-1-1}}=9.29}


SE(b1)=SeSSxx=9.2937.54=1.516\displaystyle{SE\left(b_1\right)=\frac{S_e}{\sqrt{SS_{xx}}}=\frac{9.29}{\sqrt{37.54}}=1.516}


t=b1SE(b1)=6.661.516=4.39\displaystyle{t=\frac{b_1}{SE\left(b_1\right)}=\frac{6.66}{1.516}=4.39}


Ho:β1=0H_o:\beta _1=0 There is no linear relationship.”

Ha:β1≠0H_a:\beta _1\neq0 There is a linear relationship.” (2-tail test)

The null hypothesis HoH_o that there is no significant relationship between xx and yy is rejected if:

  • |t-score| > |critical value|
  • the p-value < significance level (5%)

df=n−k−1=10−1−1=8df=n-k-1=10-1-1=8

CV=2.306CV=2.306


t=4.49>CVt=4.49>CV

0.002 < p-value < 0.01


p-value is less than the significance level (0.05)


Reject Ho, there is a significant linear relationship between the average years of service and revenue.


T-table:
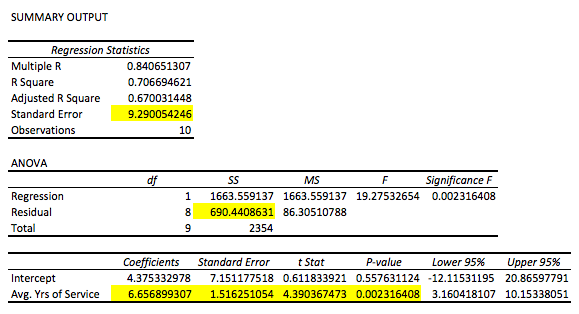


Image illustrating Example


Image illustrating Example


Abby is a sales associate at Dana’s, a high-end retail store. Sales associates do not get commission but are entitled to year-end bonuses, depending on sales.


Abby wants to see if how much one sells has an affect on the bonus they get. She samples 2 sales associates from each department (women’s, men’s, jewelry, shoes, and cosmetics) who are willing to disclose how much they sold last month (in $ thousands) and what their bonus was.


Results:


Illustration for practice question: Hypothesis Testing: Linear Regression

Illustration for practice question: Hypothesis Testing: Linear Regression


(i) State the hypotheses.

Choose an answer

Create a free account to get started

Unlock full course notes by signing up

  • Video lessons taught by top educators
  • Practice questions with guided solutions
  • Written review notes for reference
  • Expert answers anytime from course tutors