
Contingency Table
A contingency table, also known as cross tabulation or crosstab, is a matrix format that displays the frequency distribution of variables. It is a two-way table that displays the frequency counts of two categorical variables.
Example
There are two ways to treat Idiocy, an epidemic disease: medication or natural remedies. The contingency table below summarizes the success rate of each treatment. Which treatment is better?

To get a better idea about the rate of success for each treatment, we need to convert this table from counts to percentages.
Do we convert to percentages of the row totals or the column totals?
It depends on the context.
Row Totals


Column Totals

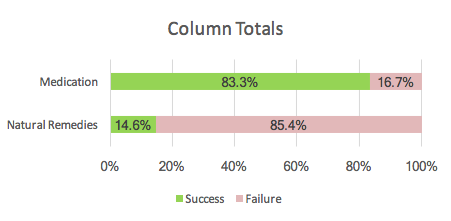
Here, the column totals are much more useful than the row totals because you can compare success rates:
- 83.3% of those who received medication were successfully treated.
- Only 14.6% of those who received natural remedies were successfully treated.
Simpson’s Paradox
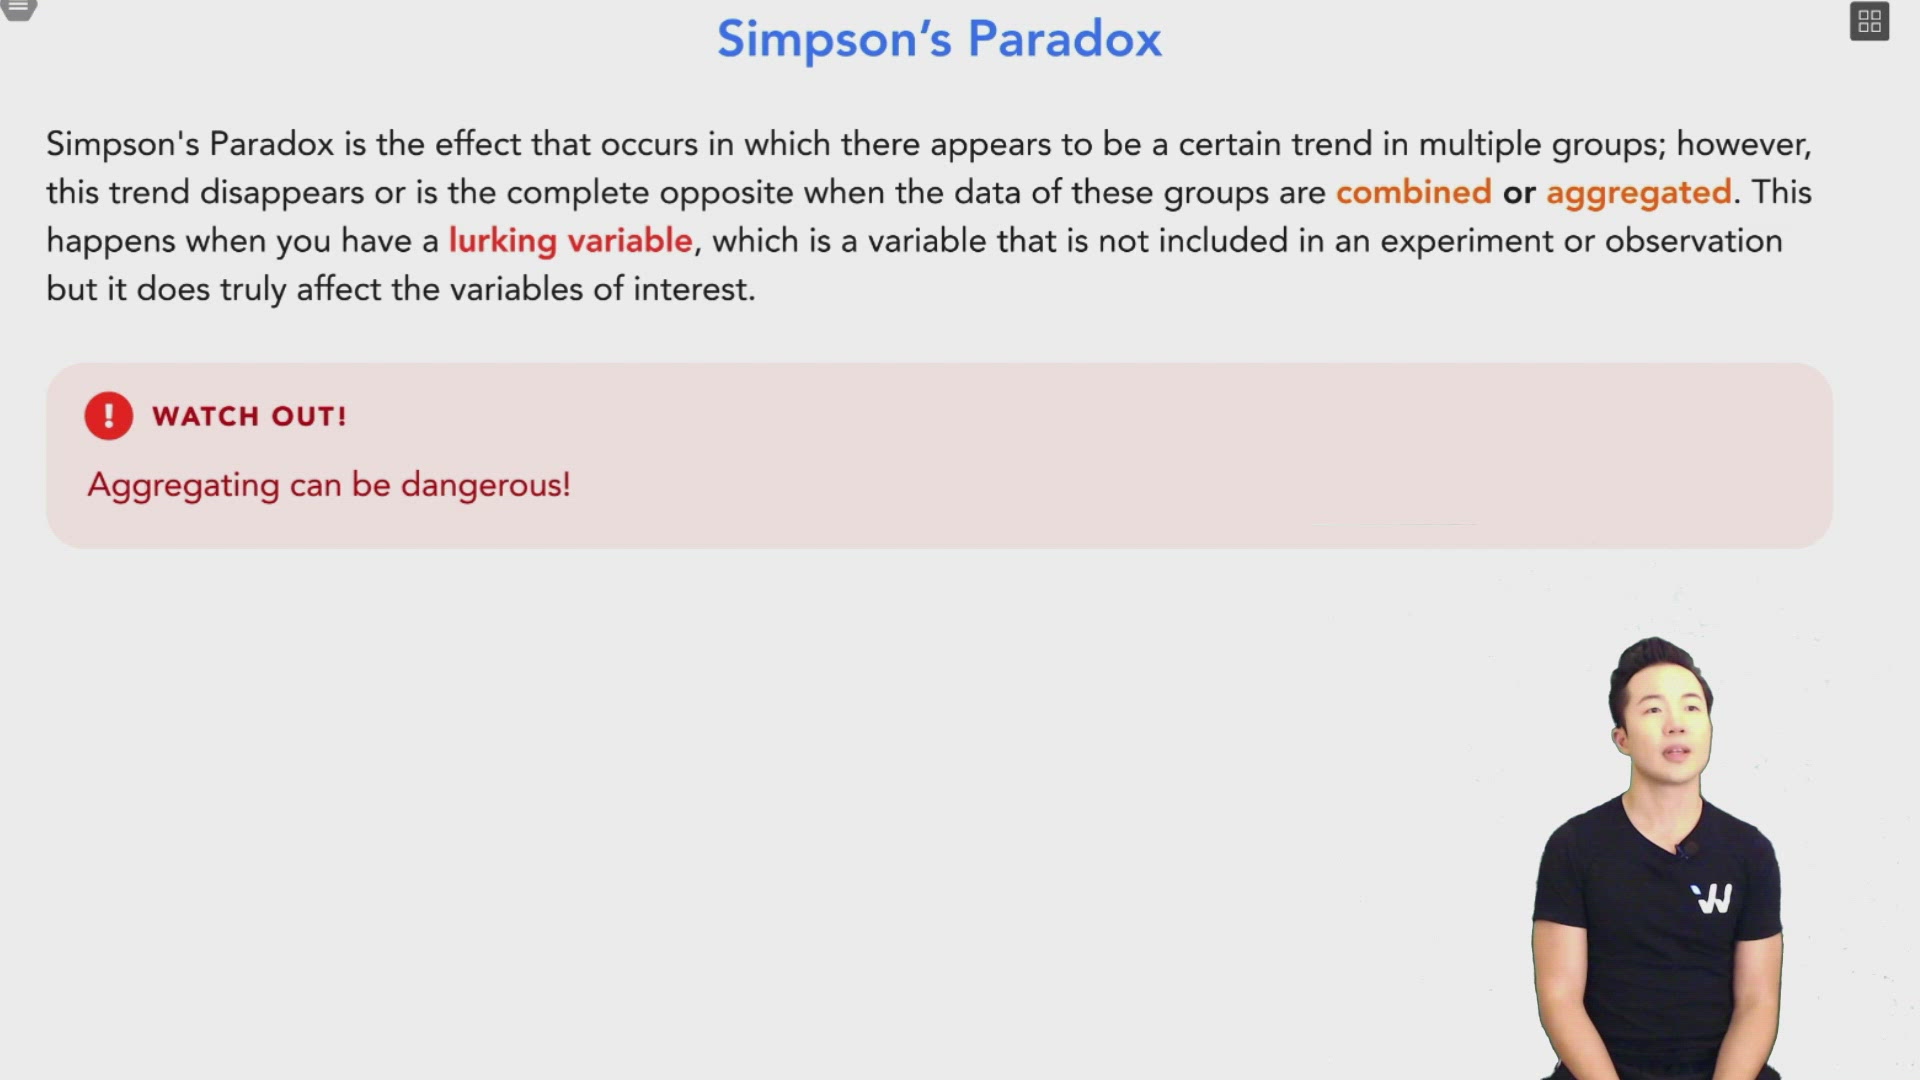
Simpson's Paradox is the effect that occurs in which there appears to be a certain trend in multiple groups; however, this trend disappears or is the complete opposite when the data of these groups are combined or aggregated. This happens when you have a lurking variable, which is a variable that is not included in an experiment or observation but it does truly affect the variables of interest.
Example:
Suppose there are two instructors for COMM 291: Dr. Simpson and Dr. Griffin. Based on the grades from the pervious term, 78 out of 240 students got A’s in Dr. Simpson’s classes; 36 out of 150 students got A’s in Dr. Griffin’s classes. In percentages:

Does this mean you have a better chance of getting an A in Dr. Simpson’s class? Is Dr. Griffin a hard or bad instructor?
Not so fast! You should be aware that they each teach three class sections, which we have aggregated.
Let’s break them down into sections:
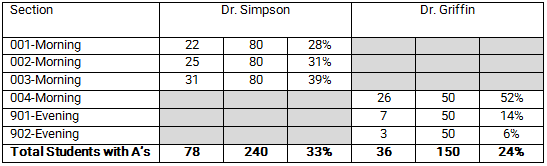
- You see that Dr. Simpson teaches all morning classes; Dr. Griffin teaches one morning class and two evening classes.
- You also see that more students get A’s in morning classes, including the morning class that Dr. Griffin teaches.
- In fact, more than half of his morning section got A’s – more than any COMM 291 section.
What is the lurking variable in this example? The sections: morning and evening.