
One-Way ANOVA Hypothesis Test
To perform a hypothesis test for the difference in several means, you will need the following information:
- The ANOVA table or the raw data (if you can use software)
- The number of groups or samples
- The significance level
- If it is not provided, you should assume it's 0.05 or see how small or large the p-value is.
Hypothesis Test Five Steps
- Step 1: Locate the relevant variables and identify the situation
- Determine if the question has more than two SRS, the populations are normally distributed, independent, and the variance of the populations can be assumed to be equal.
- Find the significance level .
- Determine the number of samples .
- Fill in or construct the ANOVA table.
- Step 2: State the hypotheses
- In this step we need to determine the null hypothesis and the alternative hypothesis (also sometimes denoted ).
- The null hypothesis
- (the population means are all equal)
- This implies the treatments had no impact on the means.
- The alternative hypothesis
- at least one of the means is different from the others
- This implies treatments don't all have the same impact.
- Thus, the hypothesis statement takes the form:
- at least one of the means is different from the others
- Step 3: Calculate the Test Statistic
- Test statistic
- The F-distribution has two degrees of freedom
- (degrees of freedom for "Between Groups")
- (degrees of freedom for "Within Groups")
- where is the overall sample size.
- Step 4: Decision Rule
- Find the p-value to compare with the significance level
- The p-value should either be given in the ANOVA table or obtained using software
- Alternatively, you can find the critical value to compare with the F statistic
- You can find the critical value using the appropriate F-table, given the significance level and degrees of freedoms ()
- Step 5: Conclusion
- If p-value Reject
- We have enough statistical evidence to conclude that at least one of the population mean differs.
- If p-value Fail to reject
- We do not have enough statistical evidence to conclude that at least one of the population mean differs.

Example: One-Way ANOVA Hypothesis Testing
Max Powers is a billionaire who owns three hockey teams. Each team has coaches with very different approaches:
- Team A is coached by a ruthless man with anger management issues;
- Team B is coached by a retired nurse and grandmother of three;
- Team C is coached by a yoga instructor
To test if his three teams differ in performance, Max compared them based on their average total points per season:
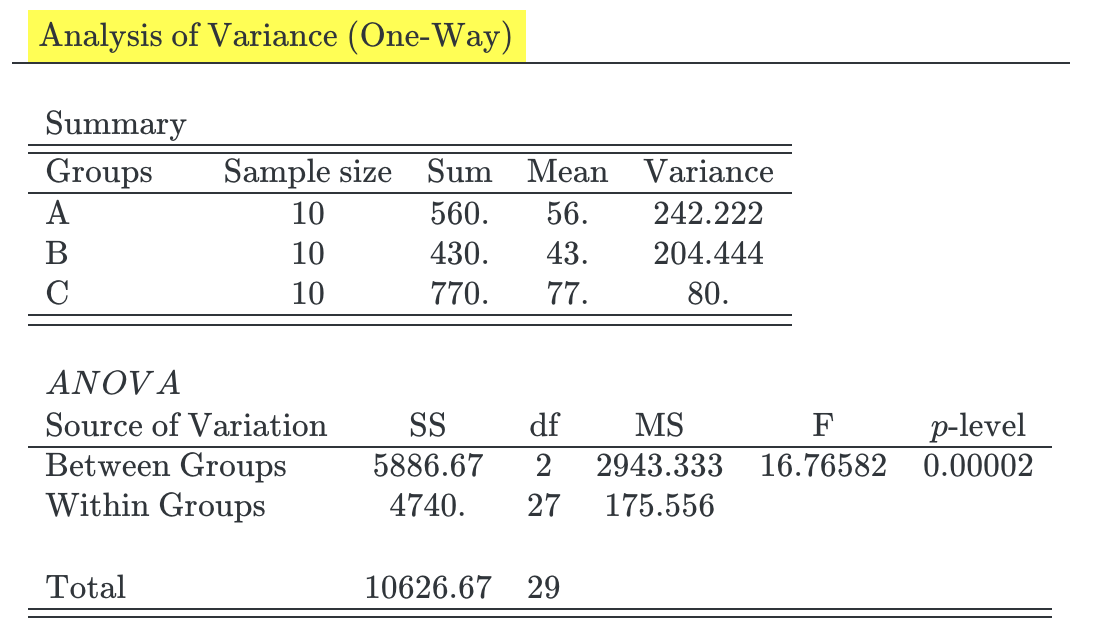
Step 1: Locate the relevant variables and identify the situation
- The following information is provided in the question:
- (No significance level provided so we assumed this)
- ANOVA table is provided.
- In this situation we know we have to use a one-way ANOVA test because:
- The question has more than two SRS.
- Populations are normally distributed (we aren't told anything in particular so we can assume).
- Populations are independent (again nothing specific is said so you can simply assume).
- The variance of the populations can be assumed to be equal (again nothing specific is said so you can simply assume).
Step 2: State the hypotheses
Step 3: Calculate the Test Statistic
Step 4: Decision Rule
- P-Value (given in ANOVA table)
Step 5: Conclusion
- therefore we reject H0. At the 5% level of significance, we have enough evidence to reject H0. At least one of the means differs from the other ones.
*Note that since we p-value is provided in the ANOVA table we could have skipped Steps 3, 4 and used that directly for the conclusion.