Create a free account to get started

Unlock full course notes by signing up

  • Video lessons taught by top educators
  • Practice questions with guided solutions
  • Written review notes for reference
  • Expert answers anytime from course tutors

Confidence Interval for Population Variance

Just like using the sample mean x‾\overline{x} to estimate the unknown population mean μ\mu and the sample proportion p^\hat{p} to estimate the unknown population proportion pp, the sample variance s2s^2 is used to estimate the unknown population variance σ2\sigma^2.


The formula for the sample variance is:


s2=∑(xi−x‾)2n−1\displaystyle\boxed{s^2=\frac{\sum_{ }^{ }\left(x_i-\overline{x}\right)^2}{n-1}}

n=n= sample size

xˉ=\bar x= sample mean


The variance follows a Chi- Square distribution. The following formula is used for the test statistic:


χ2=(n−1)s2σ2\displaystyle\boxed{\chi^2=\frac{(n-1)s^2}{\sigma^2} }


with degrees of freedom v=n−1v=n-1, formally denoted as χn−12\displaystyle{\chi^2_{n-1}} .


The above expression allows us to construct confidence intervals for the variance (provided that the population data is normally distributed). For a confidence level 1−α,1-\alpha, we get the range below:


P(χ1−α/22≤(n−1)s2σ2≤χα/22)=1−αP\left(\chi_{1-\alpha/2 }^2\le\frac{\left(n-1\right)s^2}{\sigma^2}\le \chi_{\alpha/2}^2\right)=1-\alpha


χ1−α/22=\chi_{1-\alpha/2 }^2= lower critical value


χα/22=\chi_{\alpha/2}^2= upper critical value


Doing some algebra to isolate σ2\sigma ^2we get the confidence interval for the variance:


(n−1)s2χα/22≤σ2≤(n−1)s2χ1−α/22\frac{\left(n-1\right)s^2}{\chi_{\alpha/2}^2}\le\sigma^2\le\frac{\left(n-1\right)s^2}{\chi_{1-\alpha/2}^2}


Since the Chi-Square Distribution is not symmetrical, the confidence interval we get will not be symmetric about the point estimate.


Confidence interval for the variance:

(n−1)s2χα/22≤σ2≤(n−1)s2χ1−α/22\frac{\left(n-1\right)s^2}{\chi_{\alpha/2}^2}\le\sigma^2\le\frac{\left(n-1\right)s^2}{\chi_{1-\alpha/2}^2}


Let’s simplify the equation:


(n−1)s2χUpper2≤ σ2 ≤(n−1)s2χLower2\boxed{\frac{(n-1)s^2}{\chi^2_{Upper}}\le\ \sigma^2\ \le\frac{(n-1)s^2}{\chi^2_{Lower}}}


Create a free account to get started

Unlock full course notes by signing up

  • Video lessons taught by top educators
  • Practice questions with guided solutions
  • Written review notes for reference
  • Expert answers anytime from course tutors

Example: Confidence Interval for Population Variance

A sample of 7 bottles of shampoo has the following masses:


98oz, 95oz, 100oz, 88oz, 97oz, 98oz, 92oz
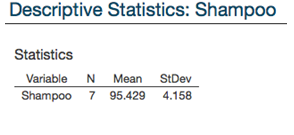

Image illustrating Example

Assume the data follow a normal distribution.


(a) Construct a 95% confidence interval for the estimate of the population variance.


Degrees of freedom:


v=n−1=7−1=6v = n − 1 = 7 − 1 = 6


Since this is a 95% confidence interval, then 1−α=0.951-\alpha= 0.95, therefore α=0.05.\alpha=0.05.


Find the critical values using the Chi-square table.


χα22=χ0.0252=14.4494  (upper)\chi_{\frac{\alpha}{2}}^2=\chi_{0.025}^2=14.4494\ \ \left(upper\right) To avoid confusion, just use the larger

number as the “upper”χ2\chi^2and use the

χ1−α22=χ0.9752=1.237   (lower)\chi_{1-\frac{\alpha}{2}}^2=\chi_{0.975}^2=1.237\ \ \ \left(lower\right) smaller number as the “lower”χ2\chi^2.


Image illustrating Example


(n−1)s2XUpper2≤σ2≤(n−1)s2XLower2\frac{\left(n-1\right)s^2}{X_{Upper}^2}\le\sigma^2\le\frac{\left(n-1\right)s^2}{X_{Lower}^2}


n=7n=7 (sample size)

s=4.158s=4.158 (sample standard deviation)

(7−1)(4.158)214.449≤σ2≤(7−1)(4.158)21.237\frac{(7−1)(4.158)^2}{14.449}\le\sigma^2\le\frac{(7−1)(4.158)^2}{1.237}


7.179≤σ2≤83.8597.179\le\sigma^2\le83.859

We are 95% confident that the true population variance is between 7.2oz and 83.9oz.


(b) Construct a 95% confidence interval for the estimate of the population standard deviation.


Confidence interval for standard deviation:


7.179≤σ≤83.859\sqrt{7.179}\le\sigma\le\sqrt{83.859}


2.68≤σ≤9.162.68\le\sigma\le9.16

We are 95% confident that the true population standard deviation is between 2.68oz and 9.16oz.


We take a random sample of 9 statistics students. The following data is based on their final grades:


Illustration for practice question: Confidence Interval for Population Variance

Assume the data follow a normal distribution. Click on 'Hint' to see formula and Chi-square Table.


(a) Construct a 95% confidence interval for the estimate of the population variance.


Enter the lower confidence level and upper confidence level with one decimal place (e.g. 12.6)


≤σ2≤\le\sigma^2\le


(b) Construct a 95% confidence interval for the estimate of the population standard deviation.


Enter the lower confidence level and upper confidence level with one decimal place (e.g. 12.6)


≤σ≤\le\sigma\le


Create a free account to get started

Unlock full course notes by signing up

  • Video lessons taught by top educators
  • Practice questions with guided solutions
  • Written review notes for reference
  • Expert answers anytime from course tutors

Example: Confidence Interval for Population Variance

Homer works in a power plant. Since his job is so important, Mr. Burns can’t afford to have Homer be late for work. He asks Smithers to monitor Homer’s punctuality. A random sample of 30 shifts reveal that Homer is late for an average of 0 minutes* with a variance of 159 minutes. Assume a normal distribution.


(*If Homer is -5 minutes late, that actually means he's 5 minutes early.)


Click on 'Hint' to see formula and Chi-square Table.


(a) Construct a 95% confidence interval for the standard deviation σ\sigma.


Enter the lower confidence level and upper confidence level by rounding to the nearest whole number (e.g. 10)


≤σ≤\le\sigma\le


(b) Can Smithers infer that the standard deviation in Homer’s punctuality is greater than 5 minutes?


Enter Y for "Yes" or N for "No".


Create a free account to get started

Unlock full course notes by signing up

  • Video lessons taught by top educators
  • Practice questions with guided solutions
  • Written review notes for reference
  • Expert answers anytime from course tutors