Create a free account to get started

Unlock full course notes by signing up

  • Video lessons taught by top educators
  • Practice questions with guided solutions
  • Written review notes for reference
  • Expert answers anytime from course tutors

Prediction Interval of Y


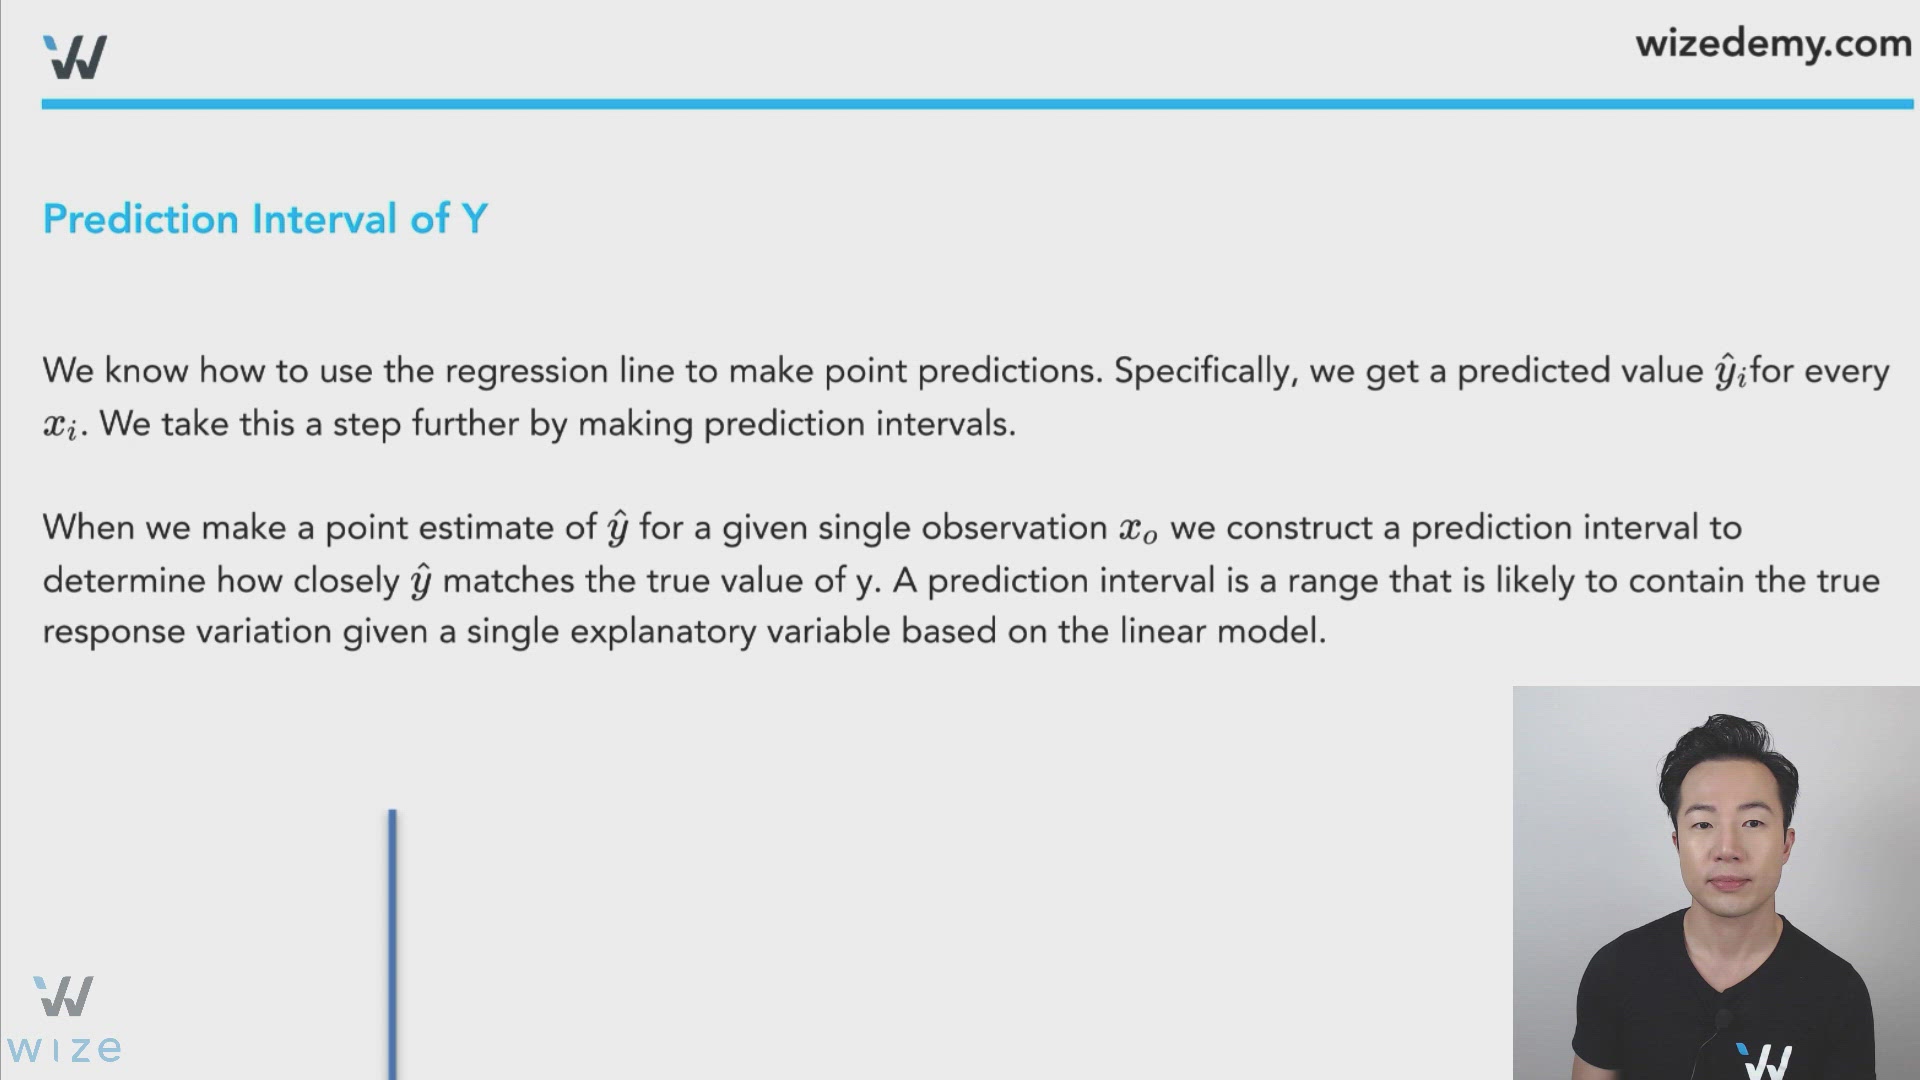
We know how to use the regression line to make point predictions. Specifically, we get a predicted value y^i\hat{y}_ifor every xix_i. We take this a step further by making prediction intervals.


When we make a point estimate of y^\hat{y} for a given single observation xox_o we construct a prediction interval to determine how closely y^\hat{y} matches the true value of yy. A prediction interval is a range that is likely to contain the true response variation given a single explanatory variable based on the linear model.



Image illustrating Prediction Interval of Y


Image illustrating Prediction Interval of Y


Distance Value

d=1n+(xo−x‾)2SSxx\displaystyle\boxed{d=\frac{1}{n}+\frac{\left(x_o-\overline{x}\right)^2}{SS_{xx}}}


Prediction interval for an individual value of y

y^±tα2Se1+d\displaystyle\boxed{\hat{y}\pm t_\frac{\alpha}{2}S_e\sqrt{1+ d}}


y^±tα2Se1+1n+(xo−x‾)2SSxx\displaystyle\boxed{\hat{y}\pm t_\frac{\alpha}{2}S_e\sqrt{1+ \frac{1}{n}+\frac{\left(x_o-\overline{x}\right)^2}{SS_{xx}}}}


Several things could cause a wider prediction interval

1) A large difference between xox_o and xˉ\bar x

2) A large residual standard deviation SeS_e

3) A larger prediction interval (e.g. a 95% PI is wider than a 90% PI)


How to construct a prediction interval


Step 1: Find y^\hat{y} given xox_o where y^=bo+b1xo\hat{y}=b_o+b_1x_o


Step 2: Find SSxxSS_{xx} and SeS_e


Step 3: Find tα2t_\frac{\alpha}{2} for a 100(1−a)100(1-a) prediction interval.


Step 4: Construct a prediction interval y^±tα2Se1+1n+(xo−x‾)2SSxx\displaystyle{\hat{y}\pm t_\frac{\alpha}{2}S_e\sqrt{1+ \frac{1}{n}+\frac{\left(x_o-\overline{x}\right)^2}{SS_{xx}}}}

Create a free account to get started

Unlock full course notes by signing up

  • Video lessons taught by top educators
  • Practice questions with guided solutions
  • Written review notes for reference
  • Expert answers anytime from course tutors

Example: Prediction Interval for Y


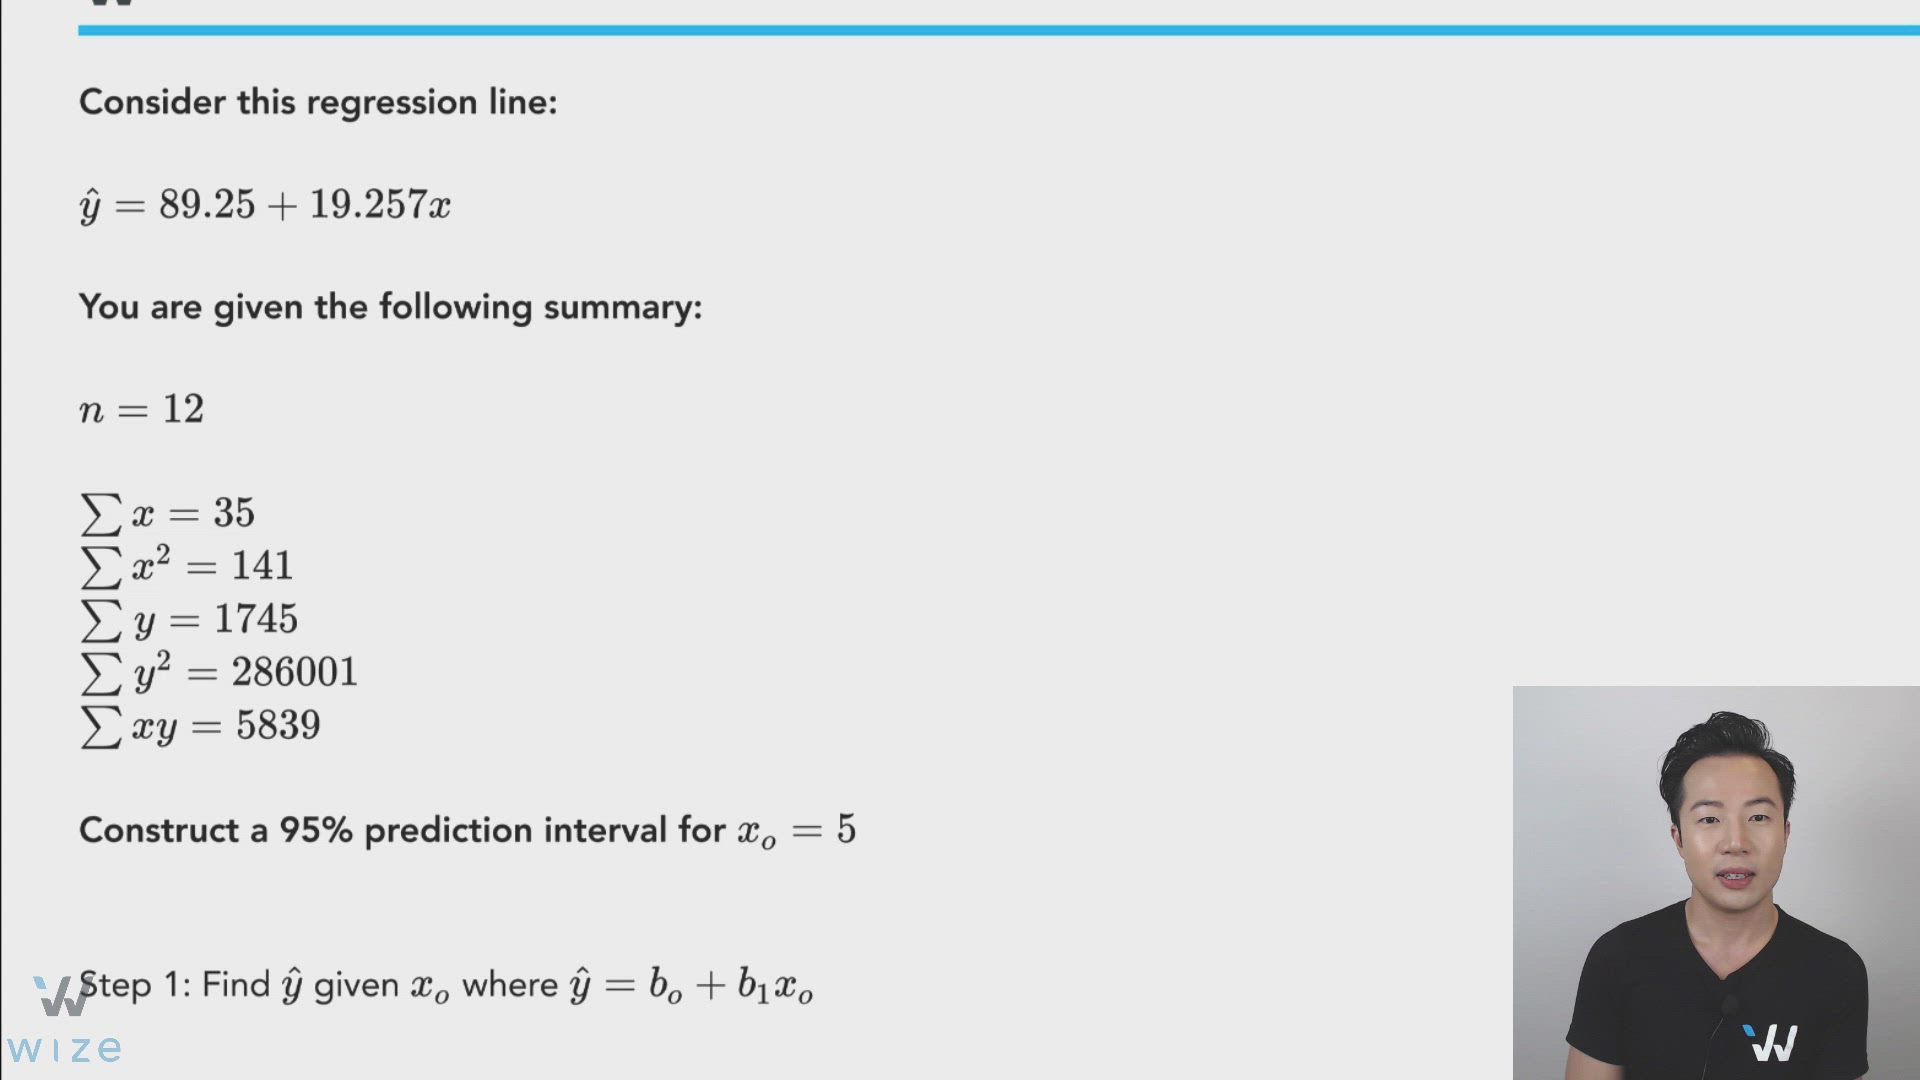
Consider this regression line:


y^=89.25+19.257x\hat{y}=89.25+19.257x


You are given the following summary:


n=12n=12


∑x=35\sum x=35

∑x2=141\sum x^2=141

∑y=1745\sum_{ }^{ }y=1745

∑y2=286001\sum_{ }^{ }y^2=286001

∑xy=5839\sum xy=5839


Construct a 95% prediction interval for xo=5x_o=5


Step 1: Find y^\hat{y} given xox_o where y^=bo+b1xo\hat{y}=b_o+b_1x_o


y^=bo+b1xo\hat{y}=b_o+b_1x_o


y^=89.25+19.257(5)=185.535\hat{y}=89.25+19.257(5)=185.535


Step 2: Find SSxxSS_{xx} and SeS_e


k=1k=1 (since there is one explanatory variable in a simple linear regression model)


SSxx=∑x2−(∑x)2n\displaystyle{SS_{xx}=\sum_{ }^{ }x_{ }^2-\frac{(\sum_{ }^{ }x_{ })^2}{n}}


SSxx=141−(35)212=38.92\displaystyle{SS_{xx}=141-\frac{\left(35\right)^2}{12}=38.92}


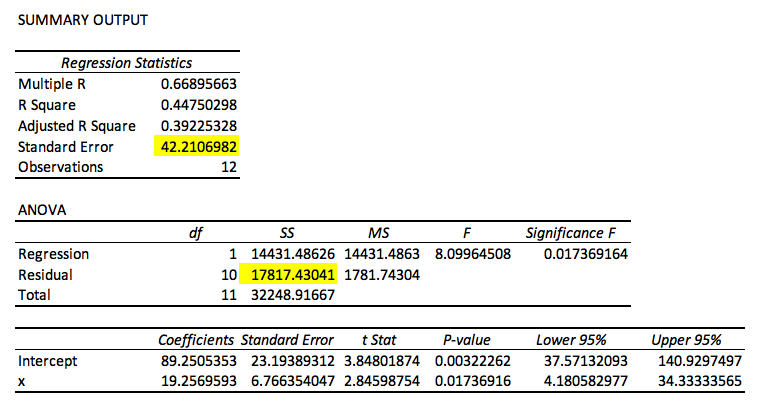
You will need SSE to find SeS_e:


SSE=∑y2−b0∑y−b1∑xySSE=\sum_{ }^{ }y_{ }^2-b_0\sum_{ }^{ }y_{ }-b_1\sum_{ }^{ }xy_{ }


SSE=286001−89.25(1745)−19.257(5839)SSE=286001-89.25\left(1745\right)-19.257\left(5839\right)

SSE=17818SSE=17818


se=SSEn−k−1\displaystyle{s_e=\sqrt{\frac{SSE}{n-k-1}}}


Se=1781812−1−1=42.21\displaystyle{S_e=\sqrt{\frac{17818}{12-1-1}}=42.21}


Image illustrating Example


Step 3: Find t⋆t^{\star} for a 95% prediction interval.


df=n−k−1df=n-k-1


df=12−1−1=10df=12-1-1=10


Image illustrating Example


t⋆=2.228t^{\star}=2.228


Step 4: Construct a prediction interval

y^±tα2Se1+1n+(xo−x‾)2SSxx\displaystyle\boxed{\hat{y}\pm t_\frac{\alpha}{2}S_e\sqrt{1+ \frac{1}{n}+\frac{\left(x_o-\overline{x}\right)^2}{SS_{xx}}}}


Distance Value:

d=1n+(xo−x‾)2SSxxd=\frac{1}{n}+\frac{\left(x_o-\overline{x}\right)^2}{SS_{xx}}


x‾=∑xn=3512=2.9167\displaystyle{\overline{x}=\frac{\sum_{ }^{ }x}{n}=\frac{35}{12}=2.9167}

d=112+(5−2.9167)238.92d=\frac{1}{12}+\frac{\left(5-2.9167\right)^2}{38.92}


d=0.1949d=0.1949


Prediction interval for an individual value of y:

y^±tα2Se1+d\boxed{\hat{y}\pm t_\frac{\alpha}{2}S_e\sqrt{1+ d}}


185.535±(2.228)(42.21)1+0.1949185.535\pm (2.228)(42.21)\sqrt{1+ 0.1949}


185.535±102.801185.535\pm102.801


[82.734,288.336][82.734, 288.336]

Given xo=5x_o=5, we predict that yy is between these two values in the 95% prediction interval.

We want to predict how much money a visitor spends at a pet convention on a given day based on the number of venders.


Illustration for practice question: Confidence Intervals: Predictions


∑x=622\sum x=622

∑x2=36714\sum x^2=36714

∑y=1060\sum_{ }^{ }y=1060

∑y2=137488\sum_{ }^{ }y^2=137488

∑xy=65655\sum xy=65655


Construct a 90% prediction interval to estimate the spending of a visitor given that there are 65 vendors. [Enter whole numbers only without the $ sign. Example: 50]


[Click on 'HINT' for steps, formulas, and t-table.]


Given that there are xo=65x_o=65 venders, we predict that a visitor would spend between $ and $ on a given day.


Create a free account to get started

Unlock full course notes by signing up

  • Video lessons taught by top educators
  • Practice questions with guided solutions
  • Written review notes for reference
  • Expert answers anytime from course tutors

Practice: Prediction Interval for Y

Which of the following is NOT a reason that a prediction interval is wide?

Choose an answer

Create a free account to get started

Unlock full course notes by signing up

  • Video lessons taught by top educators
  • Practice questions with guided solutions
  • Written review notes for reference
  • Expert answers anytime from course tutors