Prediction Interval of Y
We know how to use the regression line to make point predictions. Specifically, we get a predicted value for every . We take this a step further by making prediction intervals.
When we make a point estimate of for a given single observation we construct a prediction interval to determine how closely matches the true value of . A prediction interval is a range that is likely to contain the true response variation given a single explanatory variable based on the linear model.

Distance Value
Prediction interval for an individual value of y
Several things could cause a wider prediction interval
1) A large difference between and
2) A large residual standard deviation
3) A larger prediction interval (e.g. a 95% PI is wider than a 90% PI)
How to construct a prediction interval
Step 1: Find given where
Step 2: Find and
Step 3: Find for a prediction interval.
Step 4: Construct a prediction interval
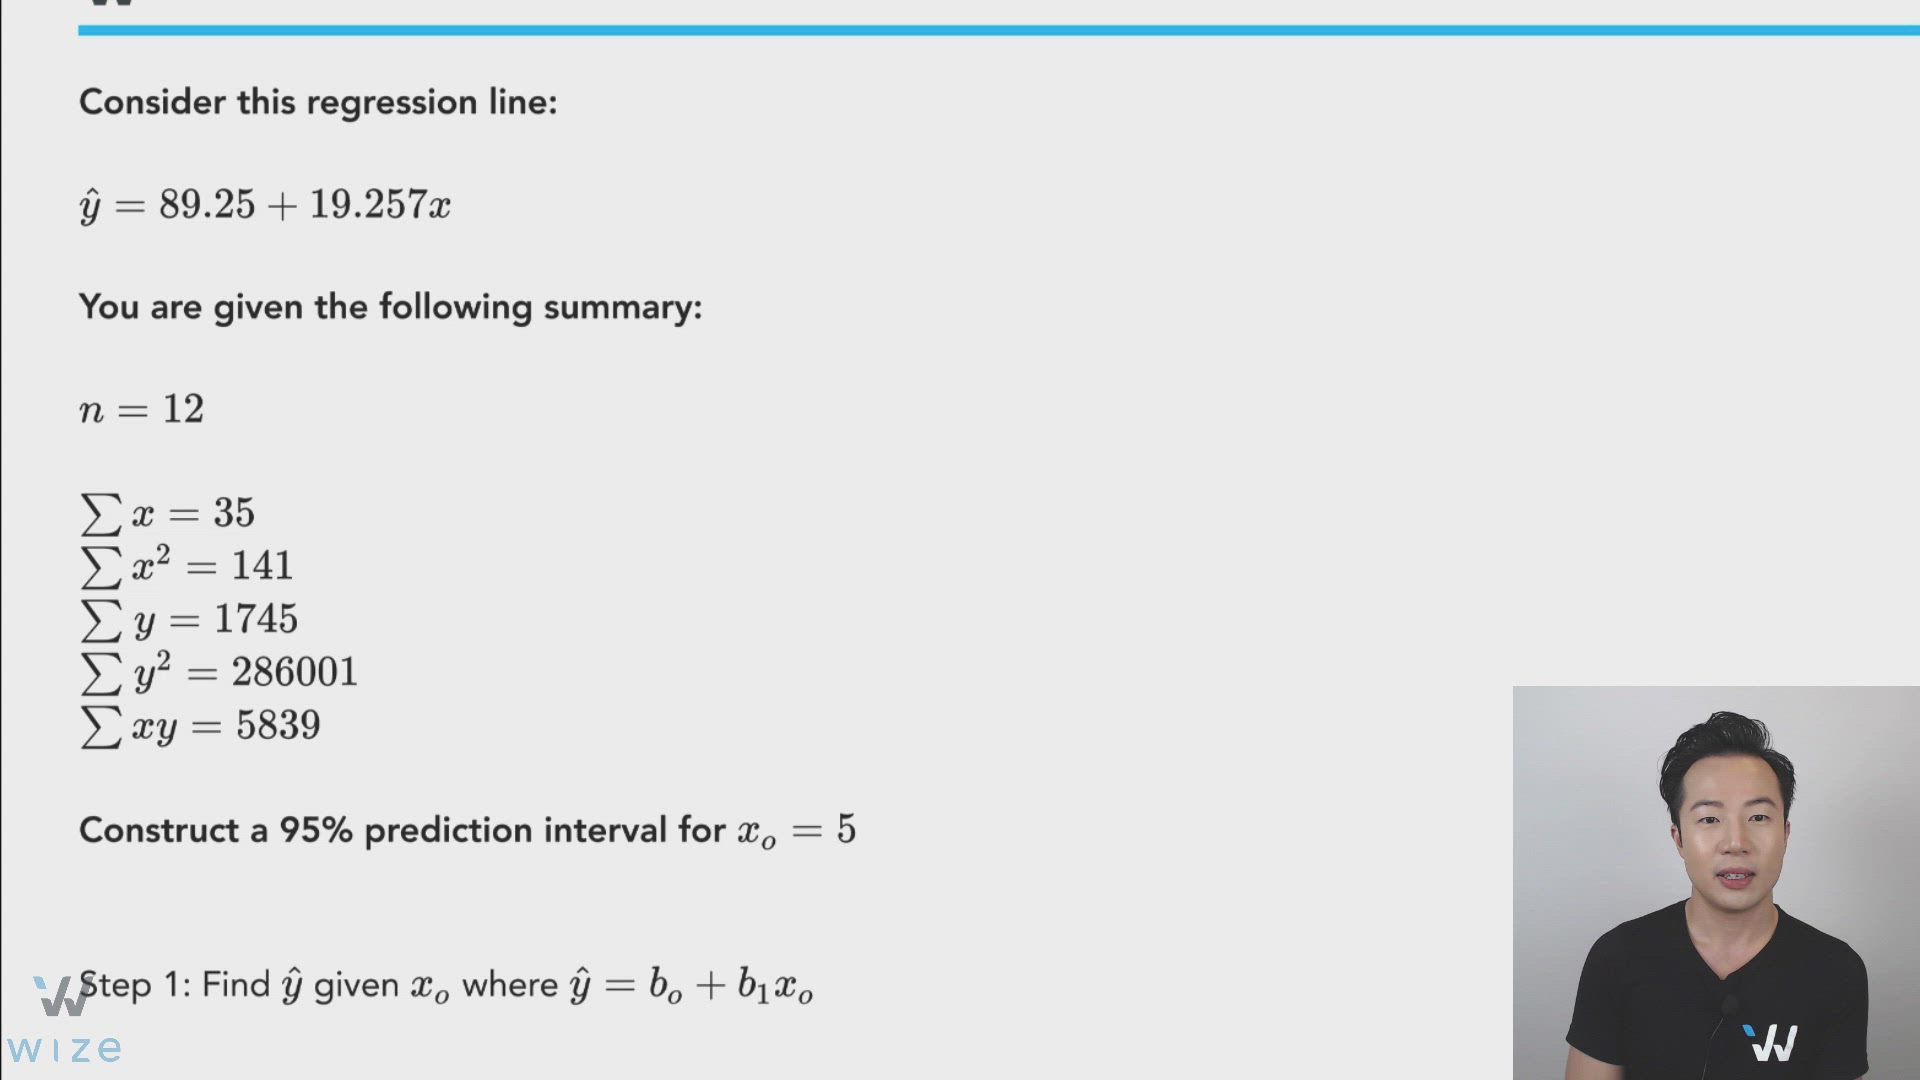
Example: Prediction Interval for Y
Consider this regression line:
You are given the following summary:
Construct a 95% prediction interval for
Step 1: Find given where
Step 2: Find and
(since there is one explanatory variable in a simple linear regression model)
You will need SSE to find :
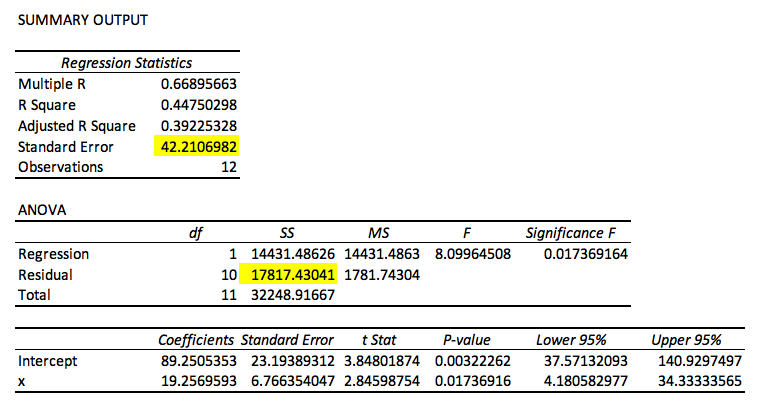
Step 3: Find for a 95% prediction interval.

Step 4: Construct a prediction interval
Distance Value:
Prediction interval for an individual value of y:
Given , we predict that is between these two values in the 95% prediction interval.