Create a free account to get started

Unlock full course notes by signing up

  • Video lessons taught by top educators
  • Practice questions with guided solutions
  • Written review notes for reference
  • Expert answers anytime from course tutors

Standard Normal Distribution (Z-Scores)

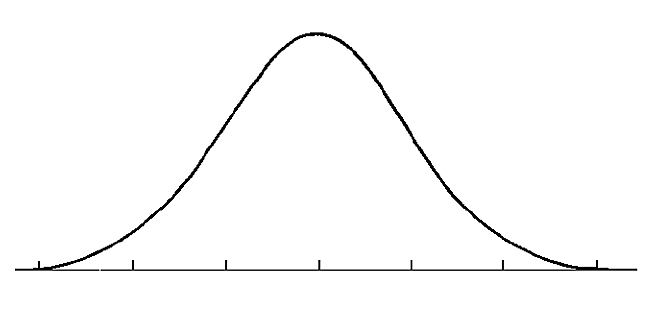
A continuous random variable ZZ follows a standard normal distribution if it's a special case of the normal distribution that is centered at 0 (i.e. μ=0\mu=0) and has a standard deviation of σ=1\sigma=1.

Image illustrating Standard Normal Distribution (Z-Scores)
  • This is a VERY useful distribution, so we give it a special variable ZZ
  • We denote this by Z ∼ N(0, 1)Z\ \sim\ N\left(0,\ 1\right)
  • We use z-scores (zz) to denote the number of standard deviations a value is away from the mean
  • If z=0z=0, the value equals the mean
  • If z>0z>0, the value is to the right of the mean
  • If z<0z<0, the value is to the left of the mean

Z-Tables

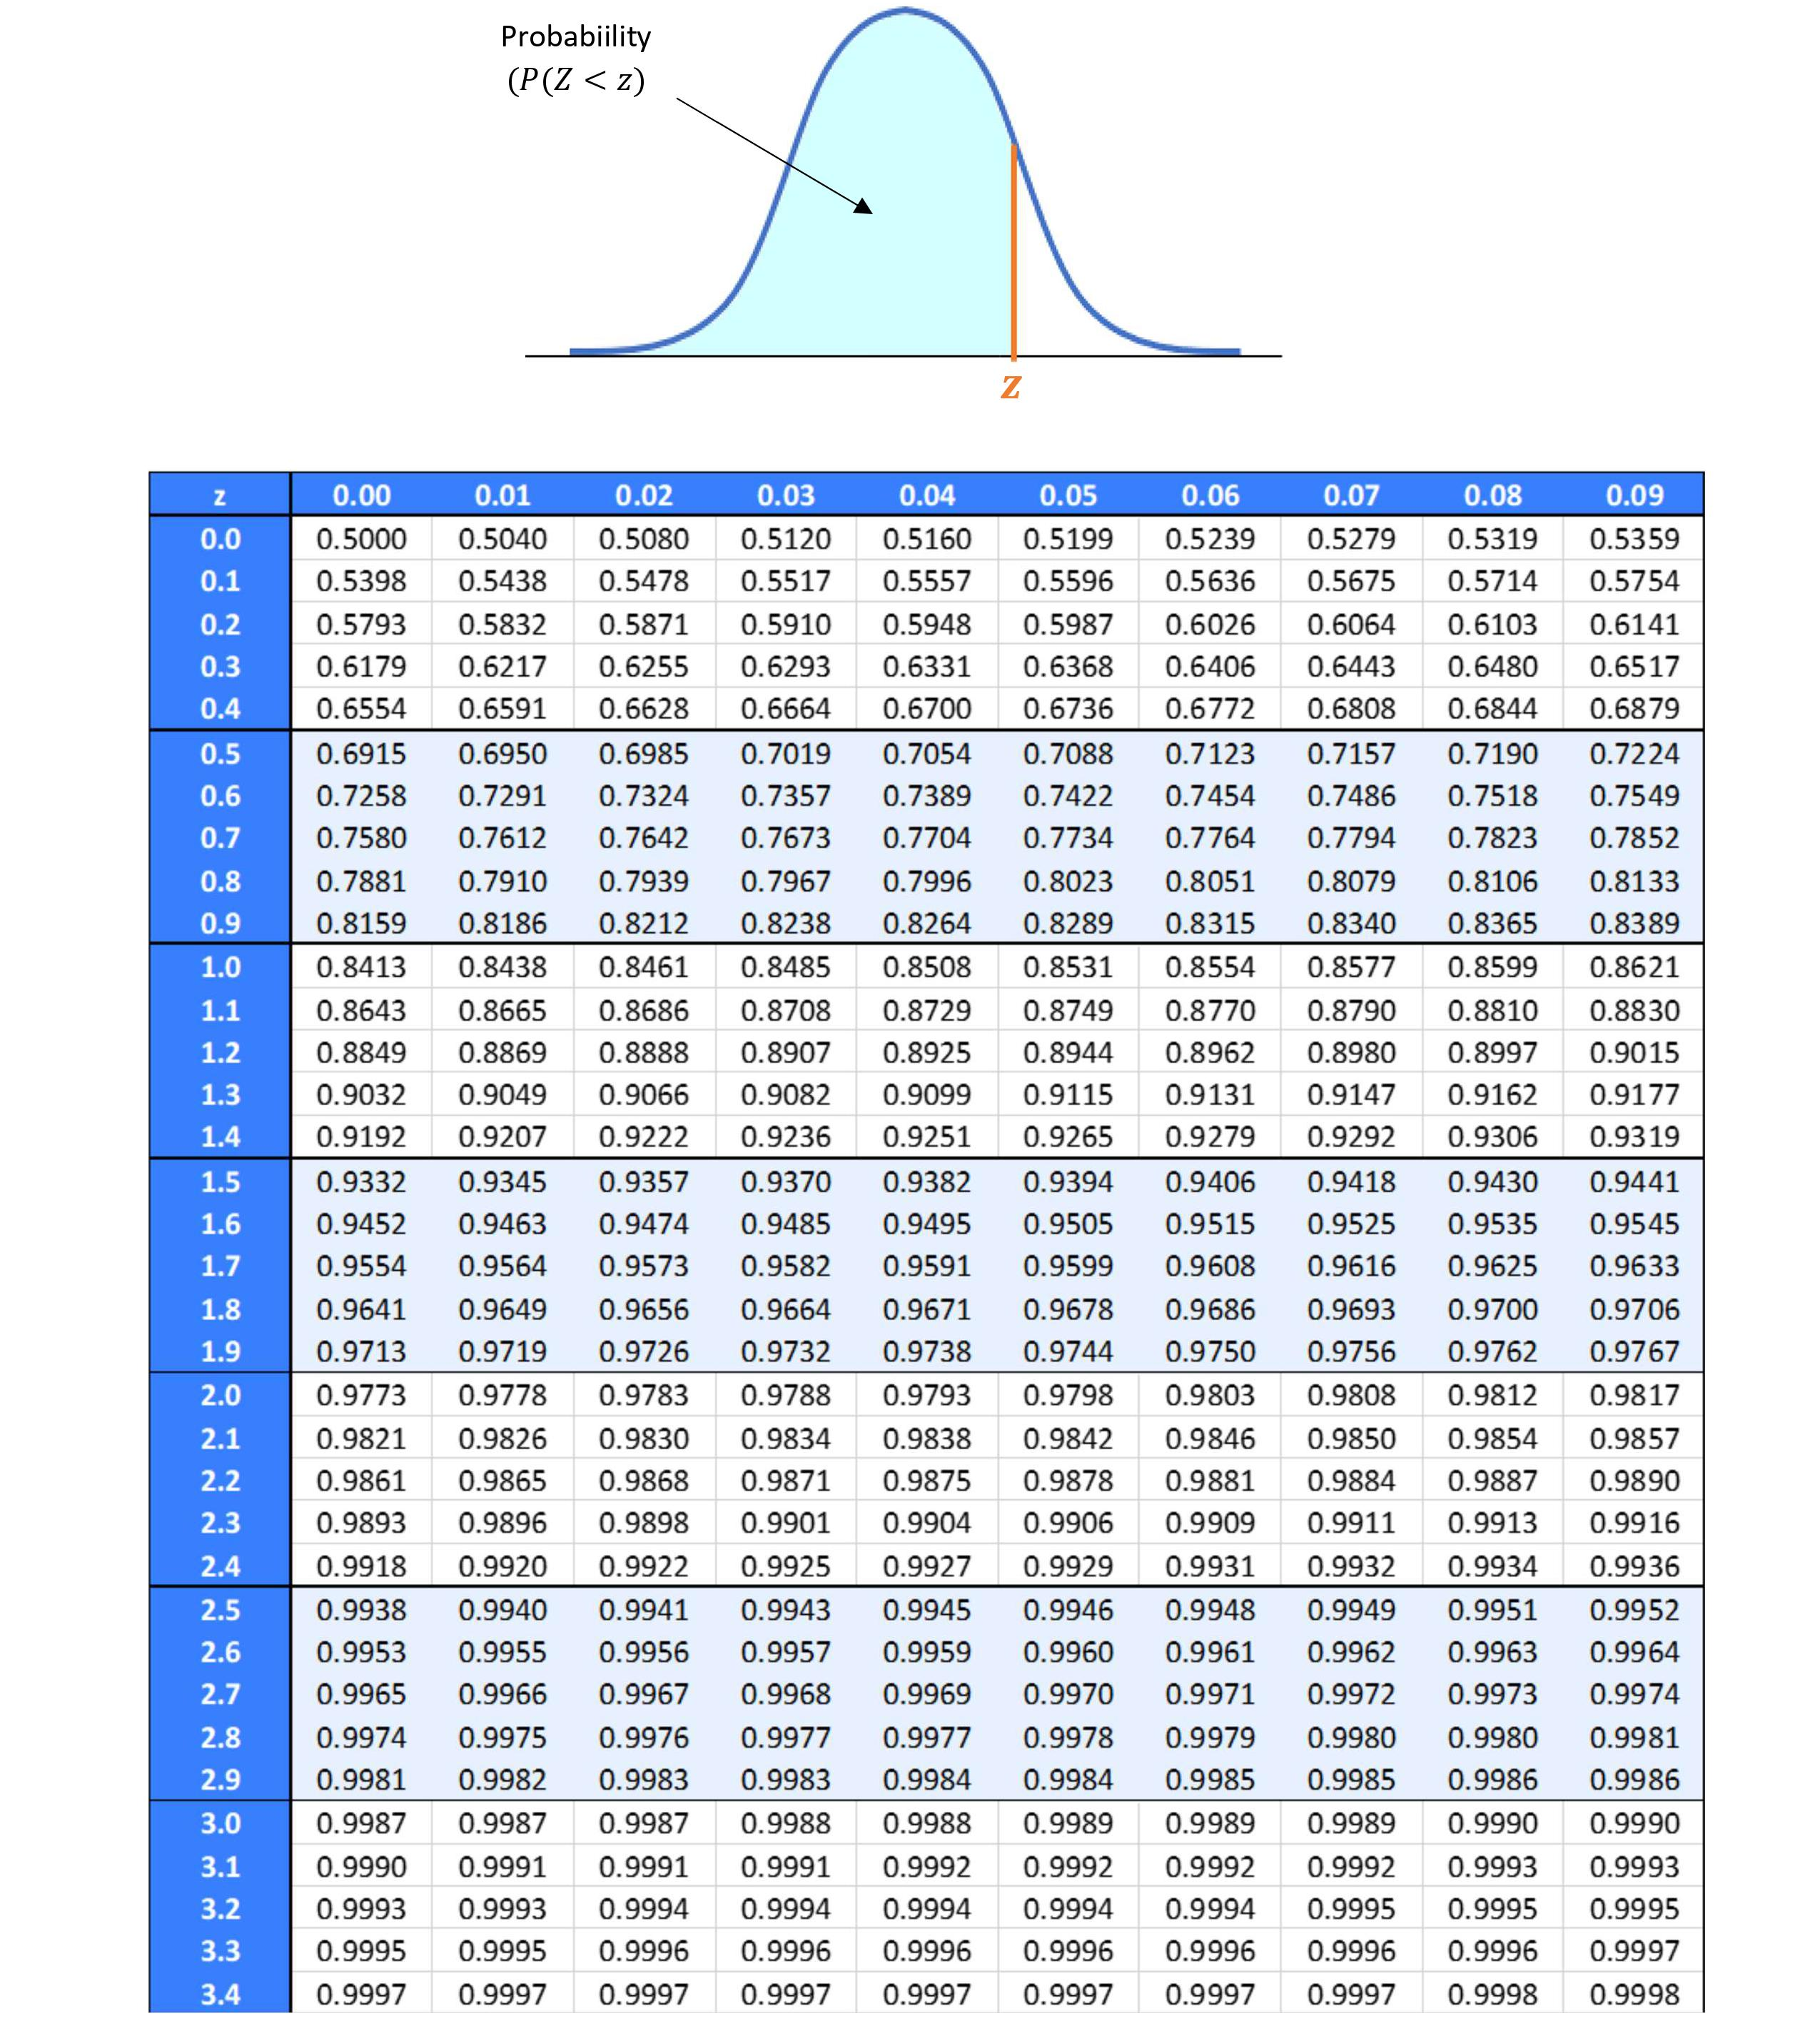
Standard normal distributions are very useful because we have a z-table (a.k.a. standard normal table) that gives us the area (i.e. probability) from the far left of the curve up to the z-value.


Examples

P(Z<1.32)=P(Z<1.32)= ________


P(Z>1.32)=P\left(Z>1.32\right)=________


Image illustrating Standard Normal Distribution (Z-Scores)


Examples

P(Z<−1.32)=P\left(Z<-1.32\right)= ________


P(Z>−1.32)=P\left(Z>-1.32\right)= ________


Image illustrating Standard Normal Distribution (Z-Scores)


Create a free account to get started

Unlock full course notes by signing up

  • Video lessons taught by top educators
  • Practice questions with guided solutions
  • Written review notes for reference
  • Expert answers anytime from course tutors

Standardizing a Normal Random Variable

Standard normal random variables are very useful since they allow us to use the z-table to solve probability problems.


What if you were asked to find the probability of a value associated with just a Normal random variable?


Standardization

Given a value associated with a normal random variable XX, we can find the z-score that corresponds to the standard normal random variable ZZ by standardizing it using this formula:

z=x−μσ\boxed{\displaystyle z=\frac{x-\mu}{\sigma}}
  • z\colorFour z is the z-score that follows the standard normal distribution ZZ
  • We can then use the z-table to solve probability problems!
  • x\colorFour x is the given value that follows the normal distribution XX
  • XX has a mean of μ\colorFour \mu
  • XX has a standard deviation of σ\colorFour \sigma

Example

Suppose XX has a normal distribution with a mean of 500 and standard deviation of 250. What is the probability that XX is 830 or higher?

Image illustrating Standardizing a Normal Random Variable


Using the standardization formula:

z=x−μσ=830−500250=1.32z=\dfrac{x-\mu}{\sigma}=\dfrac{830-500}{250}=1.32


This z-score of 1.32 tells us that value of 830 is 1.32 standard deviations above the mean, which is 500.


Using the z-table, the area (probability) to the left of 1.32 is 0.9066.


So,

P(Z>1.32)P(Z>1.32)

=1−0.9066=1-0.9066

=0.0934=0.0934


Therefore, the probability that XX has a value of 830 or higher is 0.0934.
Create a free account to get started

Unlock full course notes by signing up

  • Video lessons taught by top educators
  • Practice questions with guided solutions
  • Written review notes for reference
  • Expert answers anytime from course tutors

Practice: Standardizing

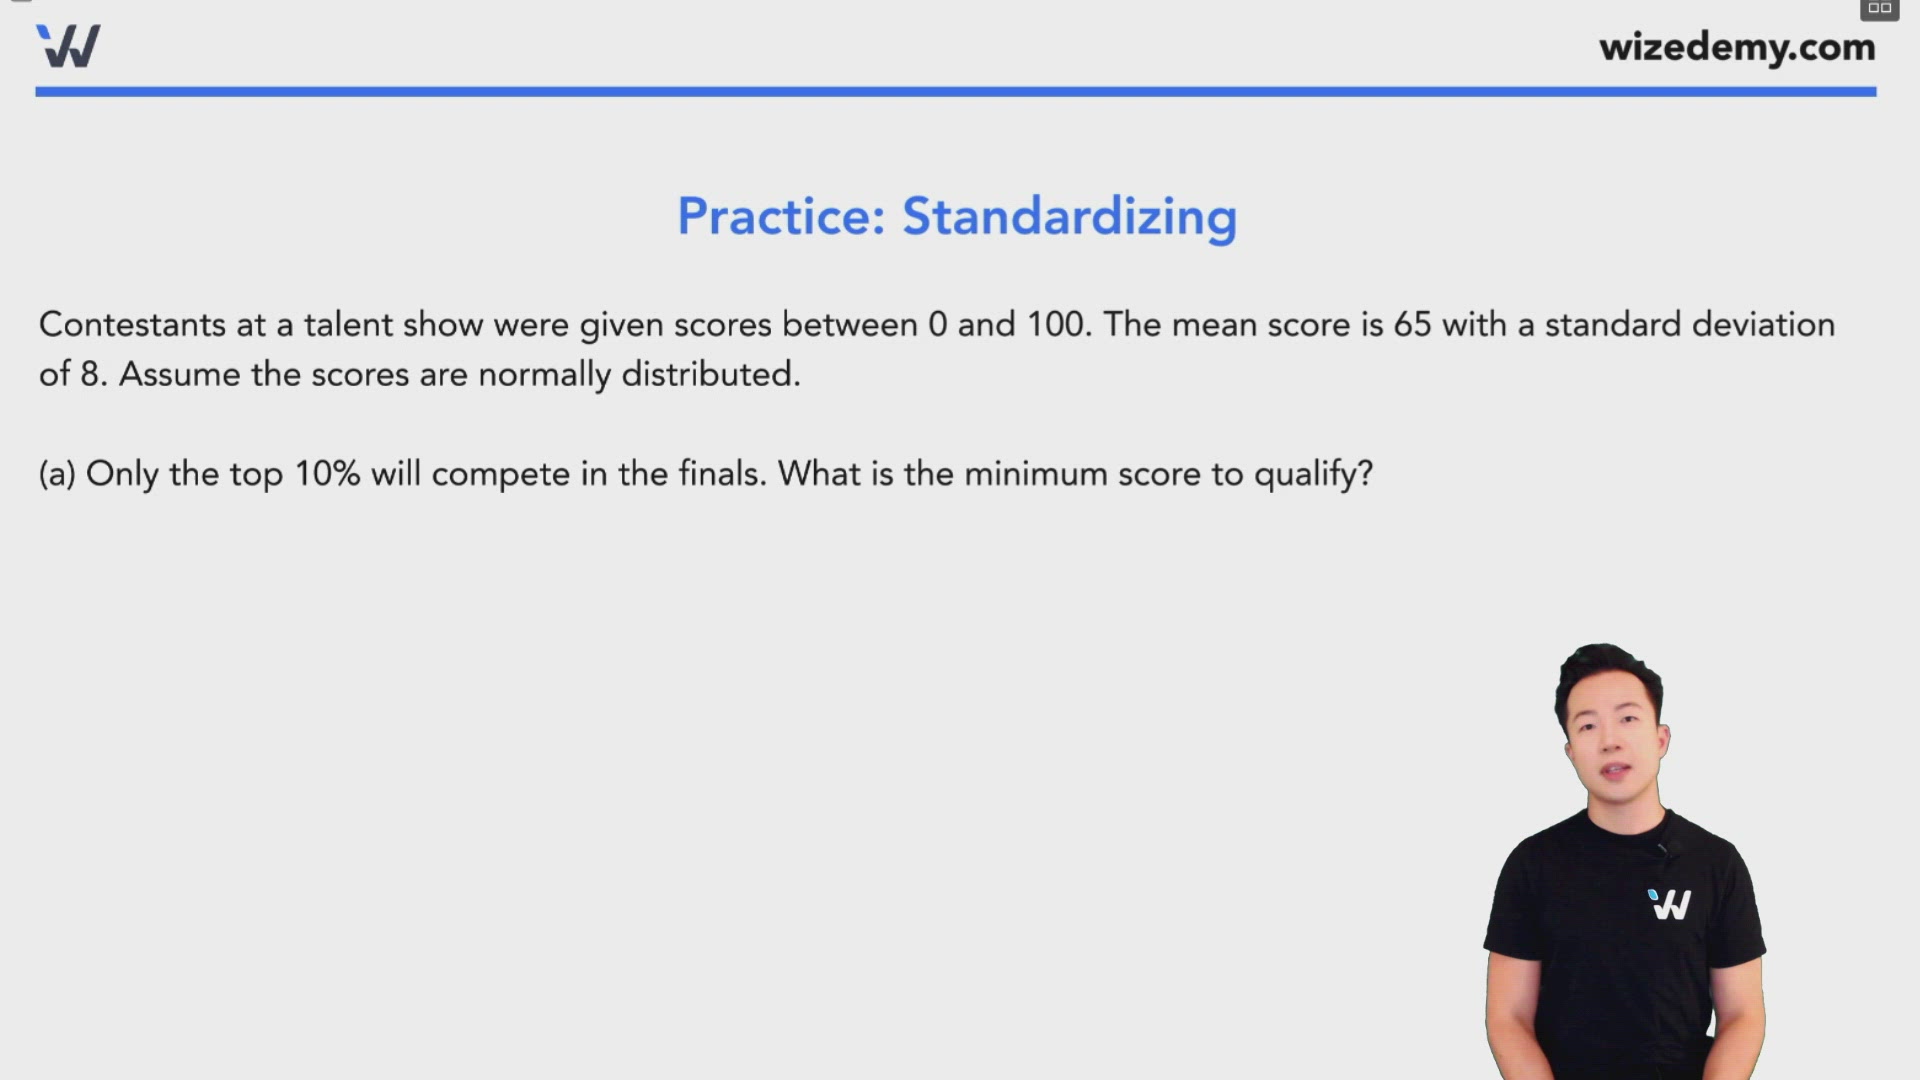
Contestants at a talent show were given scores between 0 and 100. The mean score is 65 with a standard deviation of 8. Assume the scores are normally distributed.


(a) Only the top 10% will compete in the finals. What is the minimum score to qualify?


Image illustrating Example


P(Z<1.282)=0.9P\left(Z<1.282\right)=0.9


z=X−μσz=\frac{X-\mu}{\sigma}


1.282=X−6581.282=\frac{X-65}{8}


X=75.256X=75.256


(b) What percent of the contestants received a score of 57 or lower?


Image illustrating Example


z=X−μσ=57−658=−1\displaystyle{z=\frac{X-\mu}{\sigma}=\frac{57-65}{8}=-1}


z-table: P(Z<−1)=0.1587P\left(Z<-1\right)=0.1587


Empirical Rule: P(Z<−1)=1−0.682=0.16\displaystyle{P\left(Z<-1\right)=\frac{1-0.68}{2}=0.16}


(c) What percent of the contestants received a score between 57 and 89 percent?


See graph above.


z=X−μσ=89−658=3\displaystyle{z=\frac{X-\mu}{\sigma}=\frac{89-65}{8}=3}


z-table: P(Z>3)=1−0.9987=0.0013P\left(Z>3\right)=1-0.9987=0.0013


P(57<X<89)=P(−1<Z<3)=(1−0.0013)−0.1587=0.84P\left(57<X<89\right)=P\left(-1<Z<3\right)=\left(1-0.0013\right)-0.1587=0.84


Empirical Rule: P(Z<−1)=1−0.9972=0.0015\displaystyle{P\left(Z<-1\right)=\frac{1-0.997}{2}=0.0015}


P(57<X<89)=P(−1<Z<3)=1−0.0015−0.16=0.8385P\left(57<X<89\right)=P\left(-1<Z<3\right)=1-0.0015-0.16=0.8385


The class grade on the statistics final exam is normally distributed with a mean of 65 percent and a standard deviation of 8 percent.


Illustration for practice question: Standardizing


Approximately 95% of all grades would lie between what two grades?

Your answers

Create a free account to get started

Unlock full course notes by signing up

  • Video lessons taught by top educators
  • Practice questions with guided solutions
  • Written review notes for reference
  • Expert answers anytime from course tutors


Illustration for practice question: Standardizing


Skee Ball: In order to win a $1000 prize, Billy has to roll five balls and either score below 150 or over 250. Suppose the average player scores 210 with a standard deviation of 20. Assume Bill is an average player. What is the probability that he will not win a prize?


Enter answer with at least 2 decimal places (e.g. 0.88)

Create a free account to get started

Unlock full course notes by signing up

  • Video lessons taught by top educators
  • Practice questions with guided solutions
  • Written review notes for reference
  • Expert answers anytime from course tutors

Extra Practice