Wize University Statistics Textbook > Continuous Probability Distributions
Normal Distribution
Popular Courses
COMM 214
Concordia University
STAT 151
University of Alberta
AP Statistics Exam Prep Course
AP Exam Prep
Statistics
General Course
Intro to Statistics
University Study Guides
COMM 215
Concordia University
STAT 213
University of Calgary
COMM 191
University of British Columbia
DATASCI 1000A/B
Western University
STA 100
University of California - Davis
Grade 12 Data Management
Ontario High School
High School Statistics
US High School
STATS 2244A/B
Western University
STAT 200
University of British Columbia
STAT 200
University of British Columbia
Intro to Statistics
University Study Guides
STATS 2035
Western University
STAT 161
University of Alberta
QMS 210
Toronto Metropolitan University
STAT 263
Queen's University

0:00 / 0:00
Normal Distribution
A continuous random variable follows a normal distribution if its probability distribution curve has the following properties:

- It is symmetric about the mean
- It has a bell-shape (mean=median=mode)
- The total area under the curve is equal to 1
- is the same as the area underneath the bell-curve, between the values and
- The horizontal axis measures the possible value of the continuous random variable
- The vertical axis measures the frequency or %’s
Note
We denote this as
Wize Tip
Suppose you plot continuous data in a histogram and draw a smooth curve connecting the tops of the bars. If this curve forms a symmetrical bell-shape, then we say that the data is normally distributed or follows the normal model.
Examples
- The height of a randomly selected student from a particular University
- The weight of an apple that is picked from an apple tree
Shape of a Normal Distribution
Two normal distributions can have the same mean but different standard deviations:
Example:

Two normal distributions can have different means and the same standard deviation:
Example:
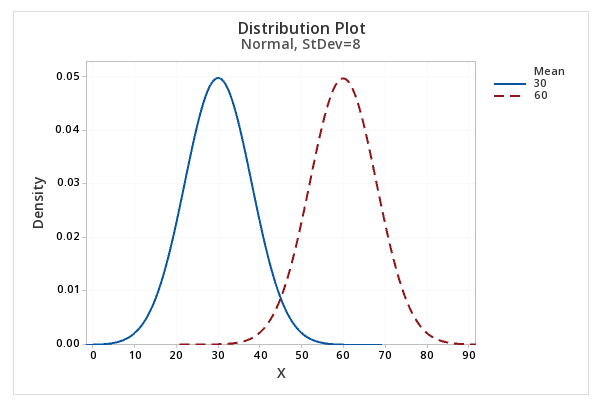
Portions of information contained in this publication/book are printed with permission of Minitab, LLC. All such material remains the exclusive property and copyright of Minitab, LLC. All rights reserved.
Empirical Rule (68 - 95 - 99.7% Rule)
The Empirical Rule states that almost all of the data fall within three standard deviations for a normal distribution.

68% Rule
- The probability that takes on a value between and is approximately 68%
- 68% of the data lies within 1 standard deviation away from the mean
95% Rule
- The probability that takes on a value between and is approximately 95%
- 95% of the data lies within 2 standard deviations away from the mean
99.7% Rule
- The probability that takes on a value between and is approximately 99.7%
- 99.7% of the data lies within 3 standard deviations away from the mean
Car batteries are designed to last on average 5 years with standard deviation of 1.3 years. Assume that battery life is normally distributed.
a) Using the 68-95-99.7% rule, what percentage of batteries will last between 2.4 and 3.7 years?
b) Using the 68-95-99.7% rule, what proportion of batteries will last under 2.4 years or more than 6.3 years?