Popular Courses
COMM 214
Concordia University
STAT 151
University of Alberta
AP Statistics Exam Prep Course
AP Exam Prep
Statistics
General Course
Intro to Statistics
University Study Guides
COMM 215
Concordia University
COMM 191
University of British Columbia
STAT 213
University of Calgary
DATASCI 1000
Western University
STA 100
University of California - Davis
Grade 12 Data Management
Ontario High School
High School Statistics
US High School
STATS 2244
Western University
STAT 200
University of British Columbia
Intro to Statistics
University Study Guides
STATS 2035
Western University
STAT 161
University of Alberta
QMS 210
Toronto Metropolitan University
STAT 263
Queen's University
STAT 2040
University of Guelph

0:00 / 0:00
Standard Normal Distribution (Z-Scores)
A continuous random variable follows a standard normal distribution if it's a special case of the normal distribution that is centered at 0 (i.e. ) and has a standard deviation of .

- This is a VERY useful distribution, so we give it a special variable
- We denote this by
- We use z-scores () to denote the number of standard deviations a value is away from the mean
- If , the value equals the mean
- If , the value is to the right of the mean
- If , the value is to the left of the mean
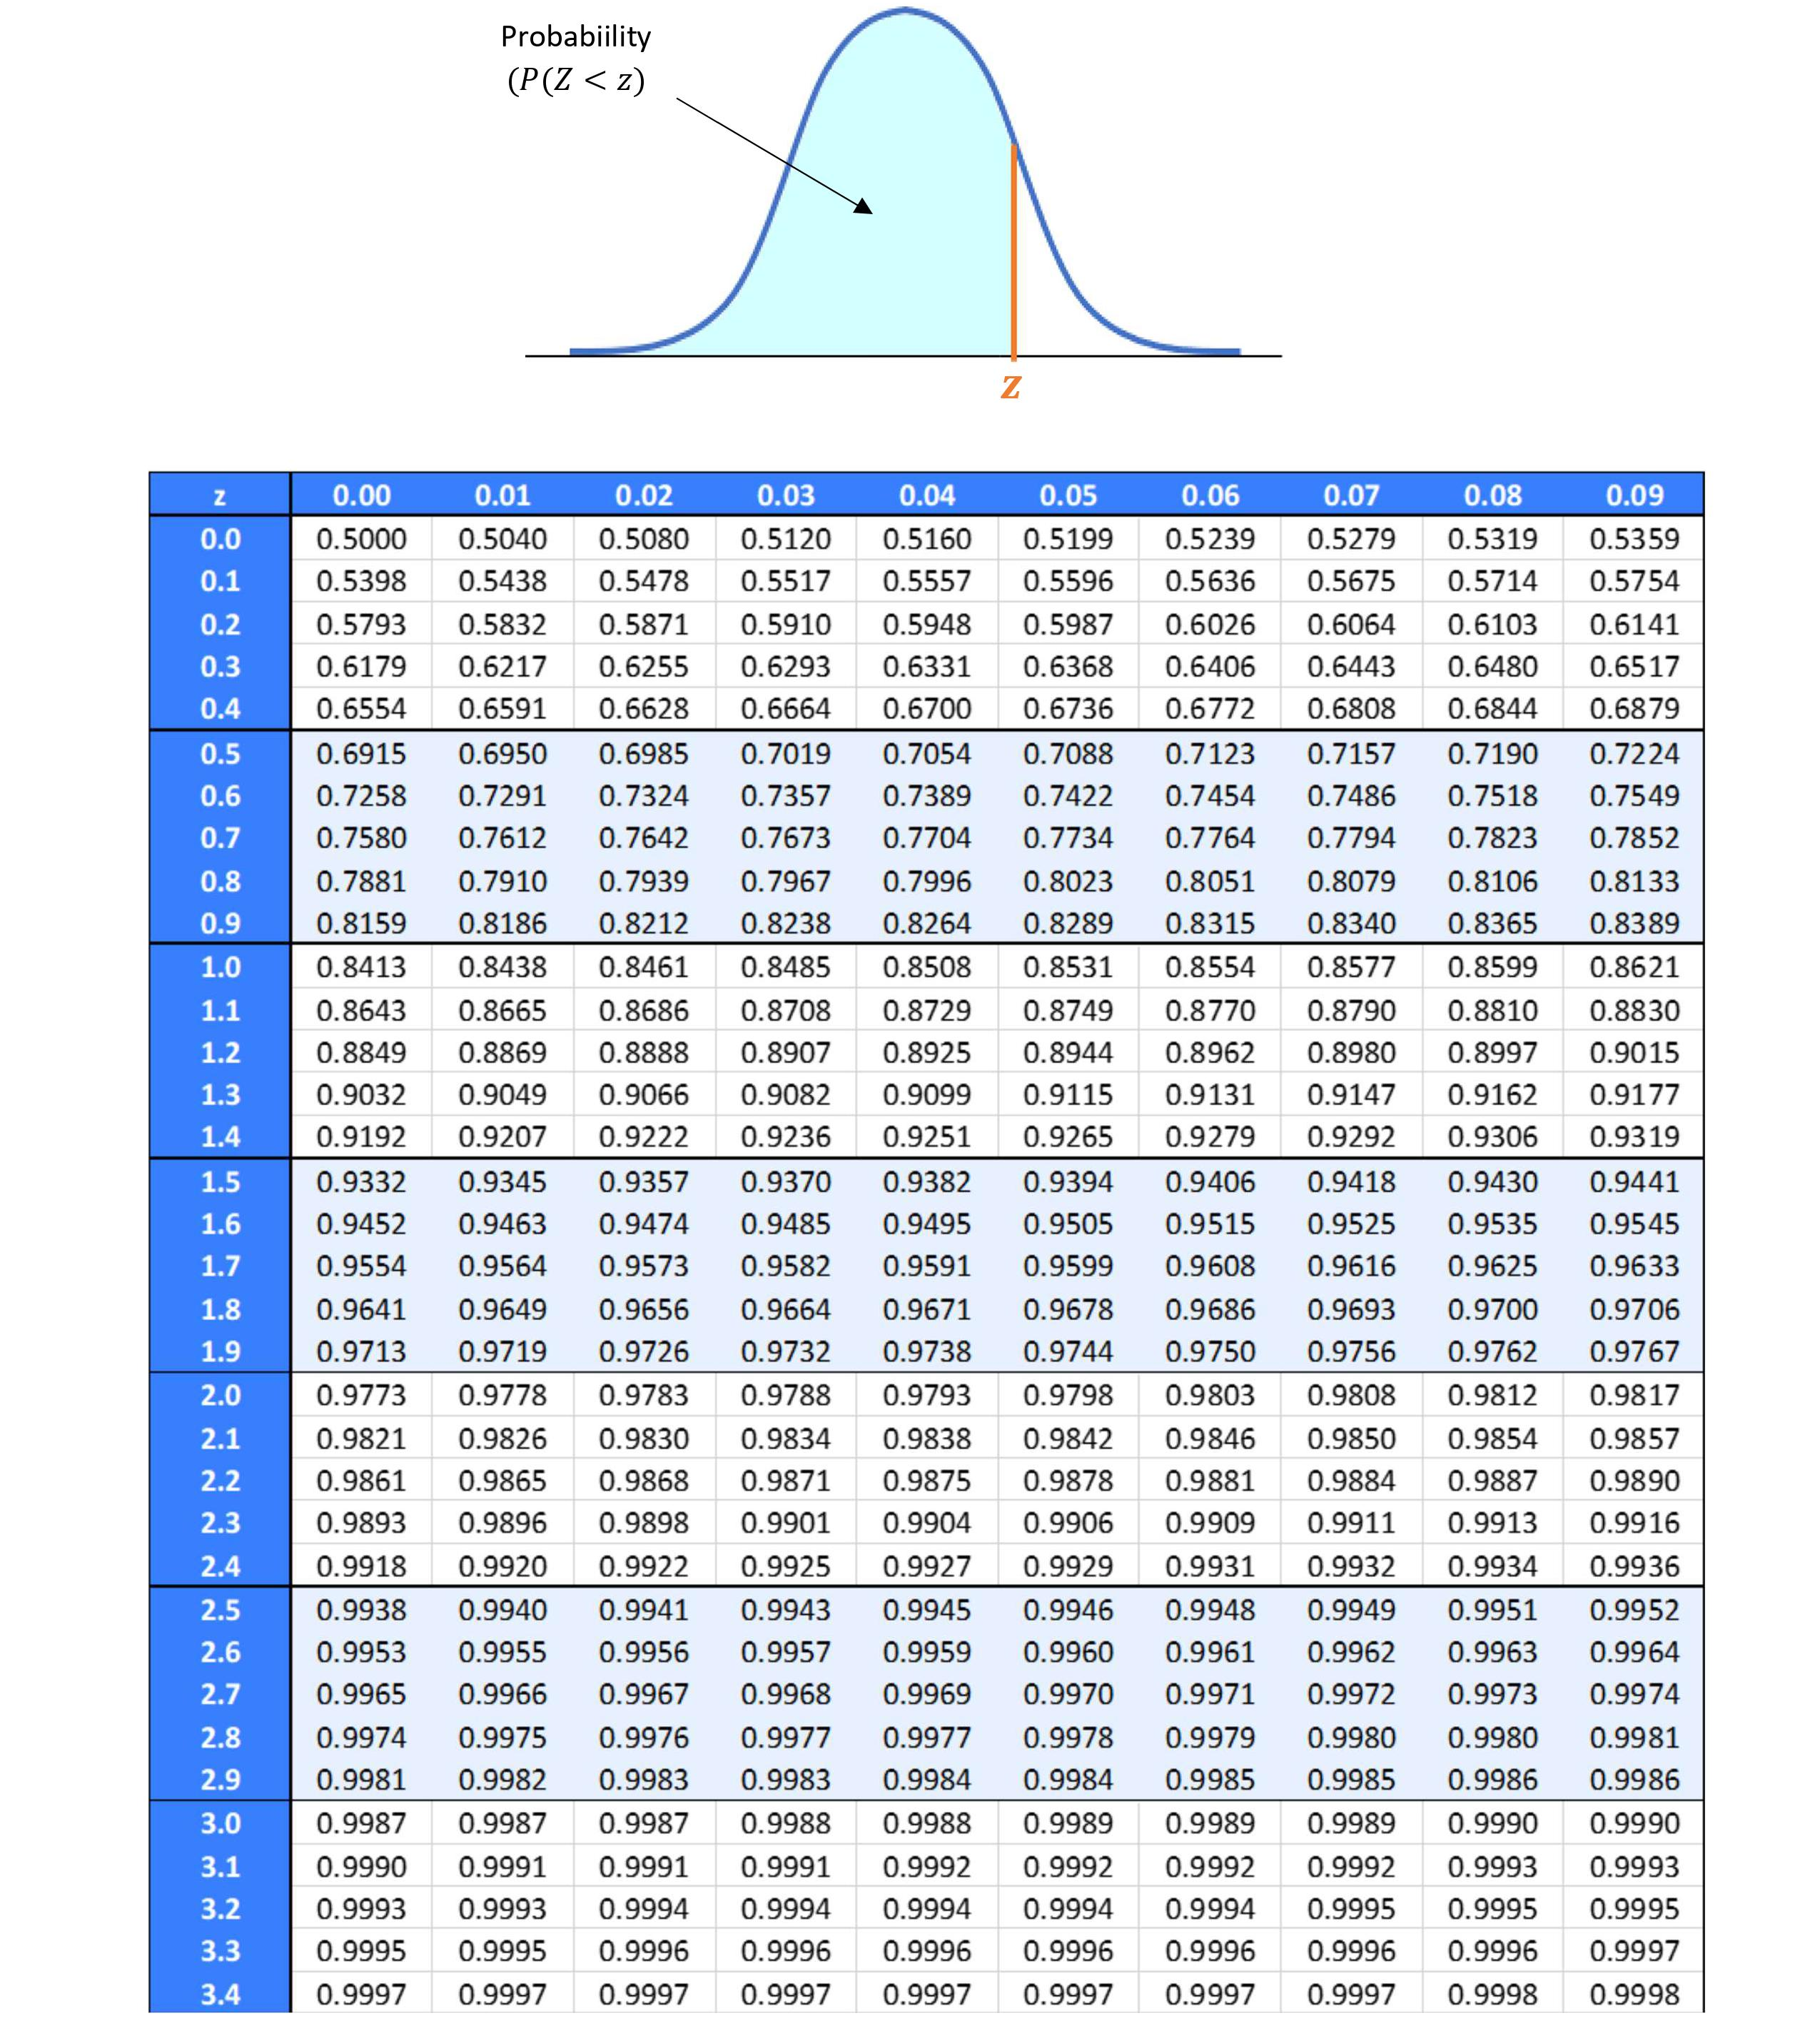
Z-Tables
Standard normal distributions are very useful because we have a z-table (a.k.a. standard normal table) that gives us the area (i.e. probability) from the far left of the curve up to the z-value.
Examples
0.9066
1 - 0.9066 = 0.0934
Examples
0.0934
1 - 0.0934 = 0.9066

Wize Tip
Since the curve is symmetrical, some profs will only give you the z-table with positive z-scores.
In this case, draw a picture to help you visualize the area that corresponds to the desired probability.
Watch Out!
Since is a continuous random variable, its probability distribution function cannot be entirely represented by a table of discrete values. That's why the z-table only shows some of the values for the distribution. Sometimes you may have to approximate the probability.

0:00 / 0:00
Standardizing a Normal Random Variable
Standard normal random variables are very useful since they allow us to use the z-table to solve probability problems.
What if you were asked to find the probability of a value associated with just a Normal random variable?
Standardization
Given a value associated with a normal random variable , we can find the z-score that corresponds to the standard normal random variable by standardizing it using this formula:
- is the z-score that follows the standard normal distribution
- We can then use the z-table to solve probability problems!
- is the given value that follows the normal distribution
- has a mean of
- has a standard deviation of
Example
Suppose has a normal distribution with a mean of 500 and standard deviation of 250. What is the probability that is 830 or higher?
Using the standardization formula:
This z-score of 1.32 tells us that value of 830 is 1.32 standard deviations above the mean, which is 500.
Using the z-table, the area (probability) to the left of 1.32 is 0.9066.
So,
Therefore, the probability that has a value of 830 or higher is 0.0934.

0:00 / 0:00
Practice: Standardizing
Contestants at a talent show were given scores between 0 and 100. The mean score is 65 with a standard deviation of 8. Assume the scores are normally distributed.
(a) Only the top 10% will compete in the finals. What is the minimum score to qualify?

(b) What percent of the contestants received a score of 57 or lower?

z-table:
Empirical Rule:
(c) What percent of the contestants received a score between 57 and 89 percent?
See graph above.
z-table:
Empirical Rule:
The class grade on the statistics final exam is normally distributed with a mean of 65 percent and a standard deviation of 8 percent.

Approximately 95% of all grades would lie between what two grades?

Skee Ball: In order to win a $1000 prize, Billy has to roll five balls and either score below 150 or over 250. Suppose the average player scores 210 with a standard deviation of 20. Assume Bill is an average player. What is the probability that he will not win a prize?
Enter answer with at least 2 decimal places (e.g. 0.88)