
0:00 / 0:00
Standard Normal Distribution (Z-Scores)
A continuous random variable follows a standard normal distribution if it's a special case of the normal distribution that is centered at 0 (i.e. ) and has a standard deviation of .

- This is a VERY useful distribution, so we give it a special variable
- We denote this by
- We use z-scores () to denote the number of standard deviations a value is away from the mean
- If , the value equals the mean
- If , the value is to the right of the mean
- If , the value is to the left of the mean
Z-Tables
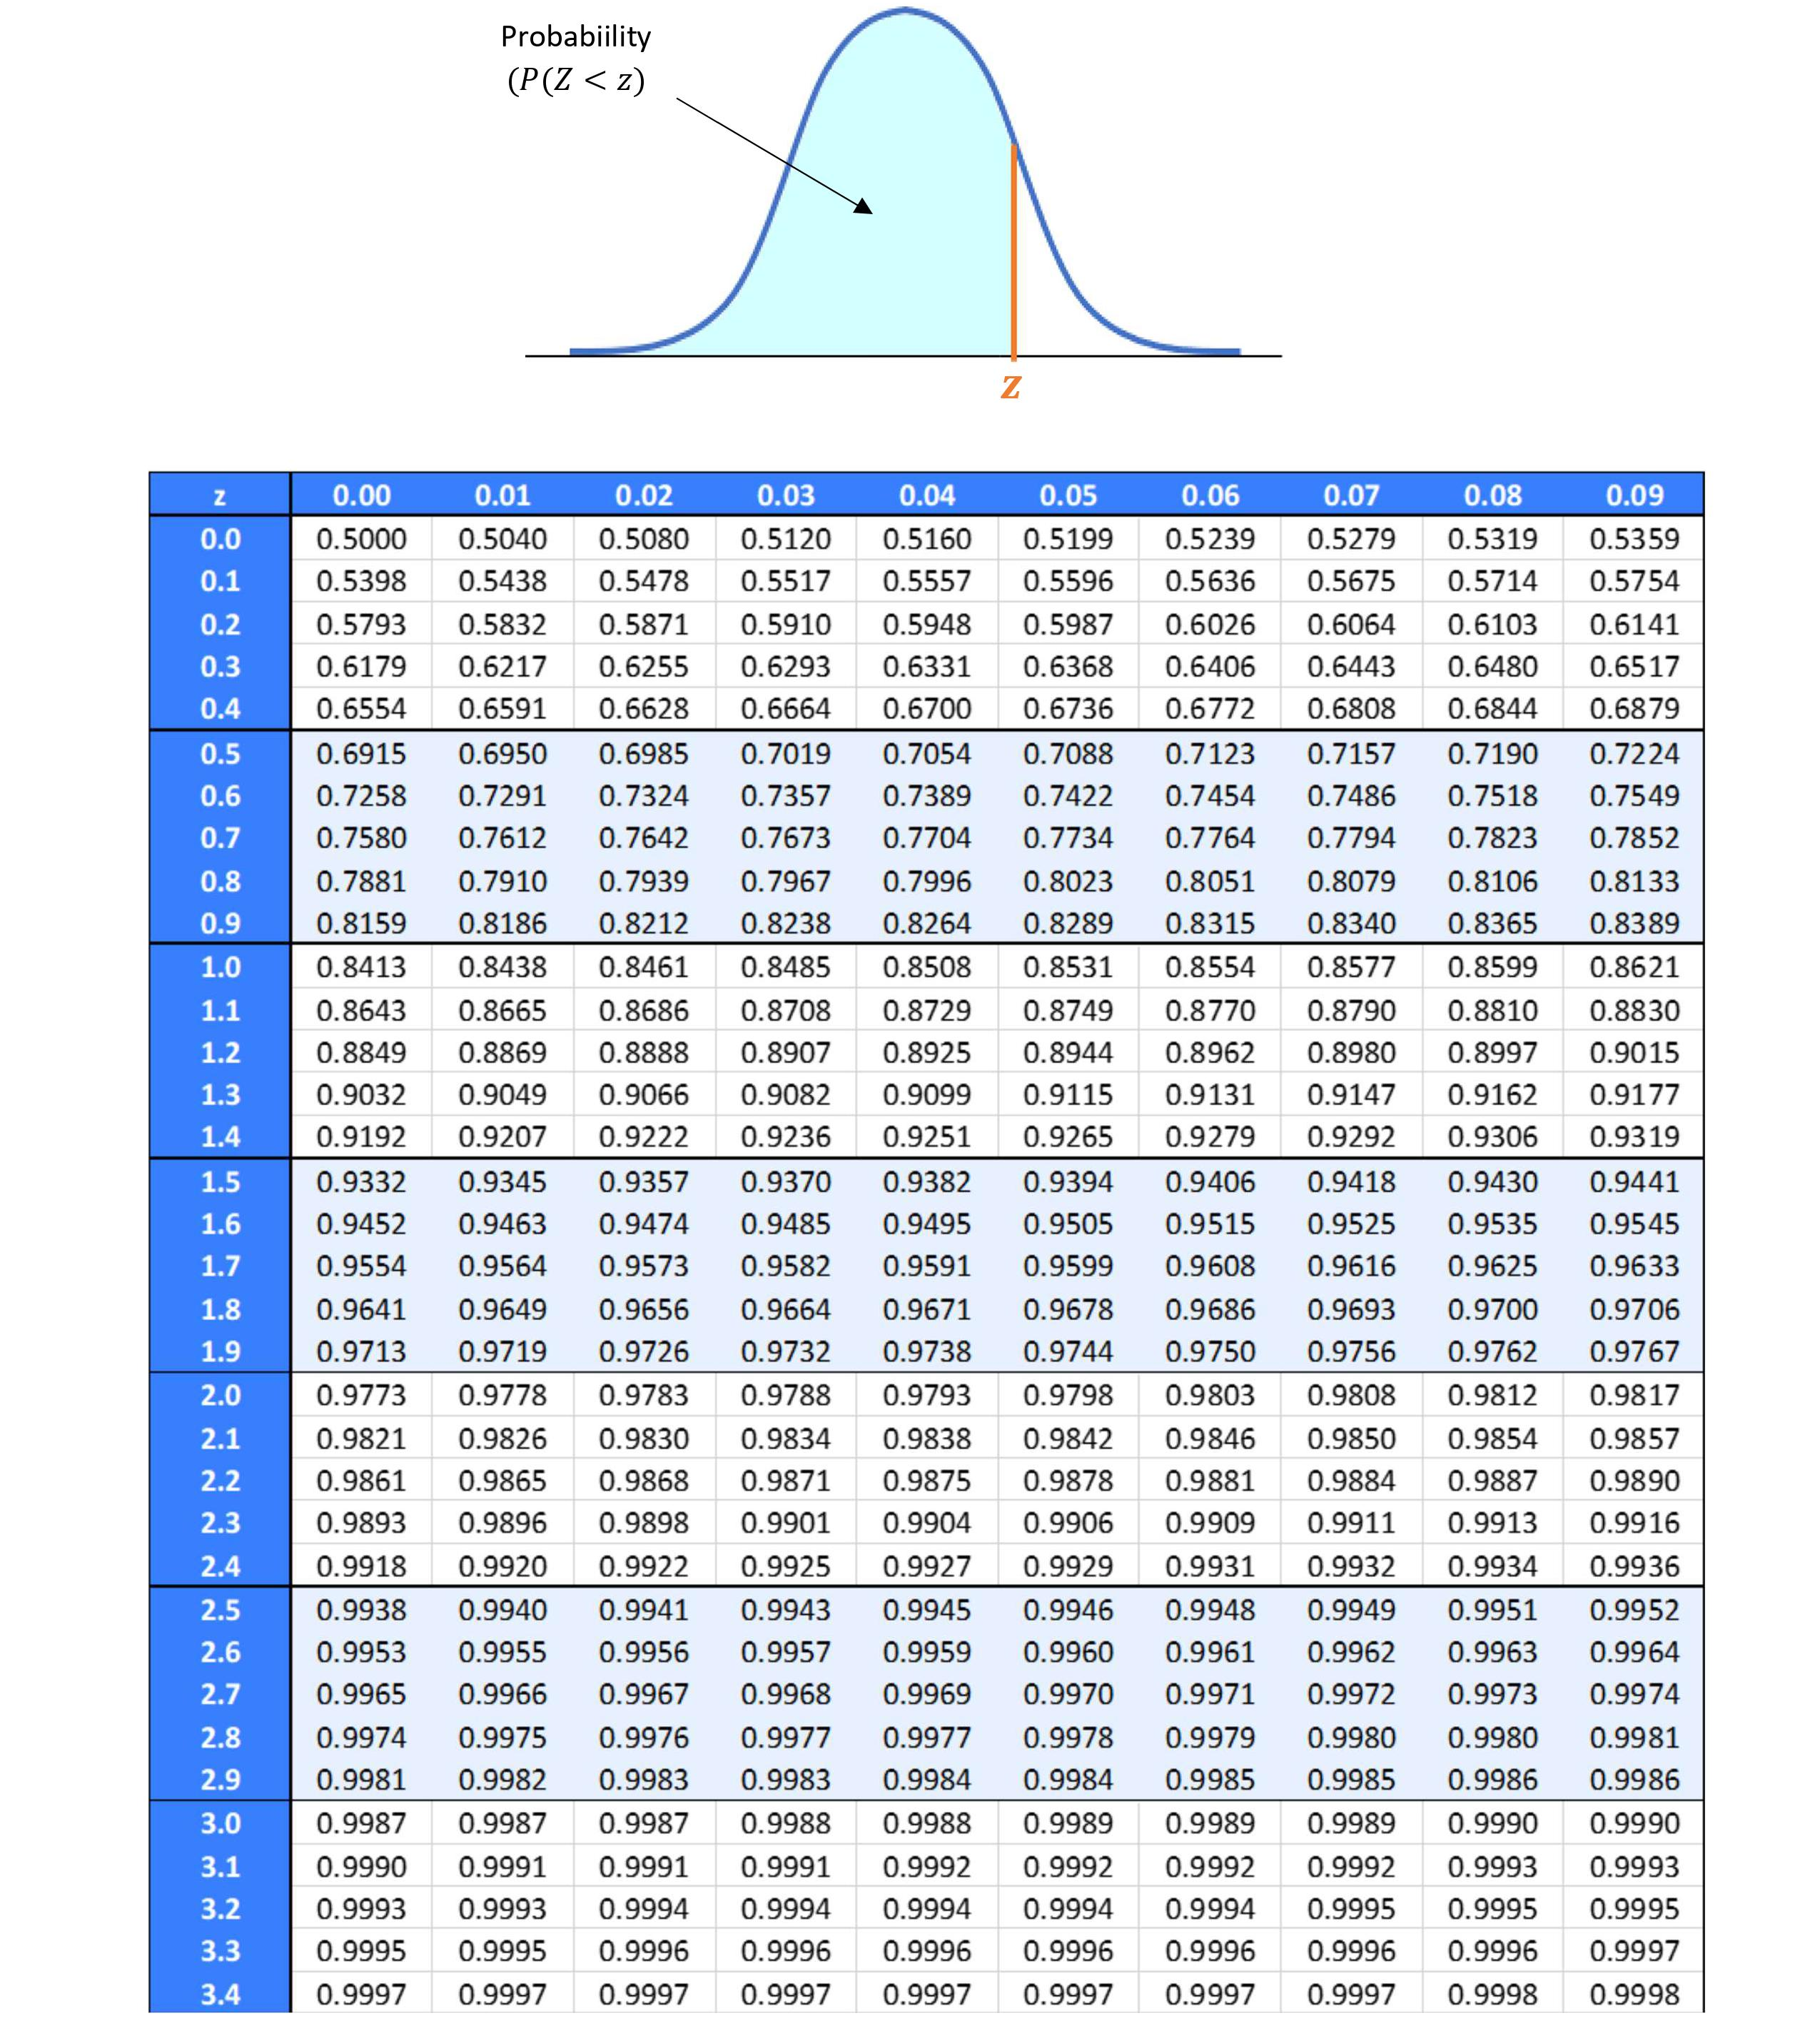
Standard normal distributions are very useful because we have a z-table (a.k.a. standard normal table) that gives us the area (i.e. probability) from the far left of the curve up to the z-value.
Examples
0.9066
1 - 0.9066 = 0.0934
Examples
0.0934
1 - 0.0934 = 0.9066

Wize Tip
Since the curve is symmetrical, some profs will only give you the z-table with positive z-scores.
In this case, draw a picture to help you visualize the area that corresponds to the desired probability.
Watch Out!
Since is a continuous random variable, its probability distribution function cannot be entirely represented by a table of discrete values. That's why the z-table only shows some of the values for the distribution. Sometimes you may have to approximate the probability.

0:00 / 0:00
Standardizing a Normal Random Variable
Standard normal random variables are very useful since they allow us to use the z-table to solve probability problems.
What if you were asked to find the probability of a value associated with just a Normal random variable?
Standardization
Given a value associated with a normal random variable , we can find the z-score that corresponds to the standard normal random variable by standardizing it using this formula:
- is the z-score that follows the standard normal distribution
- We can then use the z-table to solve probability problems!
- is the given value that follows the normal distribution
- has a mean of
- has a standard deviation of
Example
Suppose has a normal distribution with a mean of 500 and standard deviation of 250. What is the probability that is 830 or higher?
Using the standardization formula:
This z-score of 1.32 tells us that value of 830 is 1.32 standard deviations above the mean, which is 500.
Using the z-table, the area (probability) to the left of 1.32 is 0.9066.
So,
Therefore, the probability that has a value of 830 or higher is 0.0934.

0:00 / 0:00
Practice: Standardizing
Contestants at a talent show were given scores between 0 and 100. The mean score is 65 with a standard deviation of 8. Assume the scores are normally distributed.
(a) Only the top 10% will compete in the finals. What is the minimum score to qualify?

(b) What percent of the contestants received a score of 57 or lower?

z-table:
Empirical Rule:
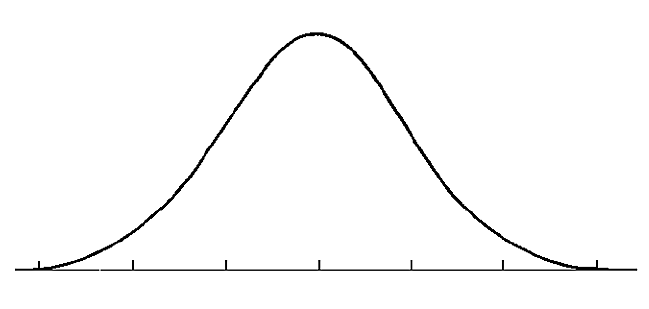
(c) What percent of the contestants received a score between 57 and 89 percent?
See graph above.
z-table:
Empirical Rule:
The class grade on the statistics final exam is normally distributed with a mean of 65 percent and a standard deviation of 8 percent.

Approximately 95% of all grades would lie between what two grades?

Skee Ball: In order to win a $1000 prize, Billy has to roll five balls and either score below 150 or over 250. Suppose the average player scores 210 with a standard deviation of 20. Assume Bill is an average player. What is the probability that he will not win a prize?
Enter answer with at least 2 decimal places (e.g. 0.88)