Wize AP Statistics Textbook > Hypothesis Testing for Mean and Proportion
Hypothesis Test for a Proportion
Popular Courses
Find My Course
0:00 / 0:00
Hypothesis Test for a Proportion
A hypothesis test may be performed for a population proportion . Be sure to review the hypothesis test steps before studying this section. For proportions we are doing a z-test!
Step 1: Identify that this is a proportion z-test!
A proportion pertains to a percentage or a fraction of the population.
Step 2: State the Hypothesis
One-tail tests:
Two-tail test:
Watch Out!
Always use the population parameter when stating the hypotheses, not the sample statistic !
Watch Out!
is not the p-value!
Watch Out!
Remember to double the p-value if it is a two-tail test!
Step 3: Ensure the conditions are met.
- Sample is randomly drawn and unbiased
- and , where is the population proportion
- The population size is at least 10 times the sample size
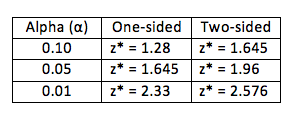
Step 4: If given significance level , find the corresponding critical value, z*
For a given choice of , find the critical value z* from the z-table (or even the t-table).
Here is a helpful table:
Watch Out!
Do not use the above table for t-tests! It is only for z-tests.
In order to reject , the absolute value of the test statistic, , needs to be greater than the critical value z*..
Finding the critical value using the z-table:

Finding the critical value using the t-table:

Step 5: Run the test statistic (z-score) and find the p-value:

Based on your z-score, you can find the p-value in the z-table.
Watch Out!
REMINDER (again): Don't forget to double the p-value if it is a two-tail test!
Step 6: Make your decision based on the p-value vs. (or |z-stat| vs. |CV|)
Is the p-value smaller than
Is the absolute value of the test statistic greater than
Is the p-value larger than
Is the absolute value of the test statistic less than
Step 7: Draw your conclusion
If you reject , there is evidence to support .
If you fail to reject , there is no evidence to support .
0:00 / 0:00
Example: Hypothesis Test for a Proportion
A survey finds that 64% of Americans in swing states vote for the federal election. We take a random sample of 50 citizens from Ohio, a swing state, and find that 28 of them voted in the 2012 federal election. Is there evidence that voter turnout in Ohio is lower than the average swing state, at the 5% significance level?
(a) State the hypotheses:
(b) Given , find the corresponding critical value, z*

(c) Run the test statistic:
(d) Solve for the p-value:
The p-value for (from the z-table).
(e) Make your decision:
i. Reject
ii. Fail to reject
Rule: The p-value needs to be smaller than the significance level in order for you to reject Ho
p-value
OR
The absolute value of the test statistic, |z|, needs to be greater than critical value z* in order for you to reject Ho
(f) Draw your conclusion:
We conclude that there is/is no evidence that voter turnout in Ohio is lower than the average swing state.
Since we fail to reject , we conclude that there is no evidence that voter turnout in Ohio is lower than the average swing state.
Bettina, the general manager of Cornwall Steakhouse, trained her service staff to suggest wine with their customers’ meals. Last month, 55% of customers ordered wine with their meal. A month following the training, she randomly selected 38 receipts. Twenty-six of them included wine sales. Is there evidence that the proportion of customers ordering wine with their meals had increased?
(i) Select the correct hypotheses.
In 2006, it was reported that only 40% of students at the university ask questions in lectures. It is believed that this percentage has changed. You randomly sampled 80 students and asked them "Have you ever asked a question in a lecture?" Twenty-four of them responded "Yes". There are 20,386 students at the university.
(i) Find the critical value for a significance level of .