
0:00 / 0:00
Types of Chi Square Tests

Chi-square tests are used for statistical inference on categorical data.
Examples of categorical variables
- Choice of major (English, Business, Biology... )
- Brand name (Toyota, BMW, Tesla... )
- Country (USA, Colombia, Philippines... )
- Flight status (On time, delayed, cancelled... )
- Day of the week (Monday, Tuesday, Wednesday... )
Chi-Square: Goodness of Fit
Use the Goodness of Fit test when you want to see if the population with an unknown distribution "fits" a known distribution. In this case, we are dealing with a single outcome of an experiment from a single population. Here, we are typically testing to see if the population is uniform (all outcomes occur with equal frequency).
Examples
- Do employees call in "sick" more often on certain days of the week?
- Do hotel guests use the middle door more often than the other doors at the entrance?
- Do people use certain fingers to press the elevator button more often than other fingers?
Illustration:
Hypotheses:
The population fits the given distribution.
The population does not fit the given distribution.
Chi-Square: Test of Independence
Use the Test of Independence when you want to see if two categorical variables are independent (has no association) or dependent (has an association). In this case, we are dealing with two qualitative survey questions or experiments, which will entail a contingency table (minimum 2x2).
Examples
- Is there an association between an actor's ethnicity and the roles they play on television?
- Is there an association between a student's gender and what program they major in?
- Do certain brands appeal more to younger consumers while other brands appeal more to older consumers?
Illustration:
Hypotheses:
The two categorical variables are independent. (There is no association.)
The two categorical variables are not independent. (There is an association.)

0:00 / 0:00
Chi-Square Test for "Goodness of Fit"
A Chi-square Goodness of Fit Test compares the observed frequencies for a categorical variable and the expected frequencies to see if there are any discrepancies between them. If there is little or no discrepancy, then we conclude that the expected frequencies “fit” the observed frequencies; hence, “goodness of fit”.
Example
I toss the die 60 times.
Observed results:

Is this a fair die?
Of course, it is. It is 100% fair. If we toss the die 60 times, we expect to get each number 10 times:

What we observe above is exactly that.
In real life, we don’t get results that perfect; there will be some discrepancy. If there is little discrepancy, then we can still conclude that the die is fair. If the discrepancy is statistically significant discrepancy – that is, the difference is not due to chance – then we conclude that the die is not fair. How do we formally test this?
where we take the sum of all the cells in the table.
# of possible outcomes or groups within a category
Hypotheses:


0:00 / 0:00
Example: Chi-Square Test for "Goodness of Fit"
Suppose we toss a die 60 times. This time, the result is this:

At the 5% significance level, is this a fair die?
“The die is fair.”
(The observed sample frequencies do not differ significantly from expected frequencies.)
“The die is not fair.”
(The observed sample frequencies differ significantly from expected frequencies.)
(a) Calculate the Chi-square test statistic.
(b) What is the degrees of freedom?
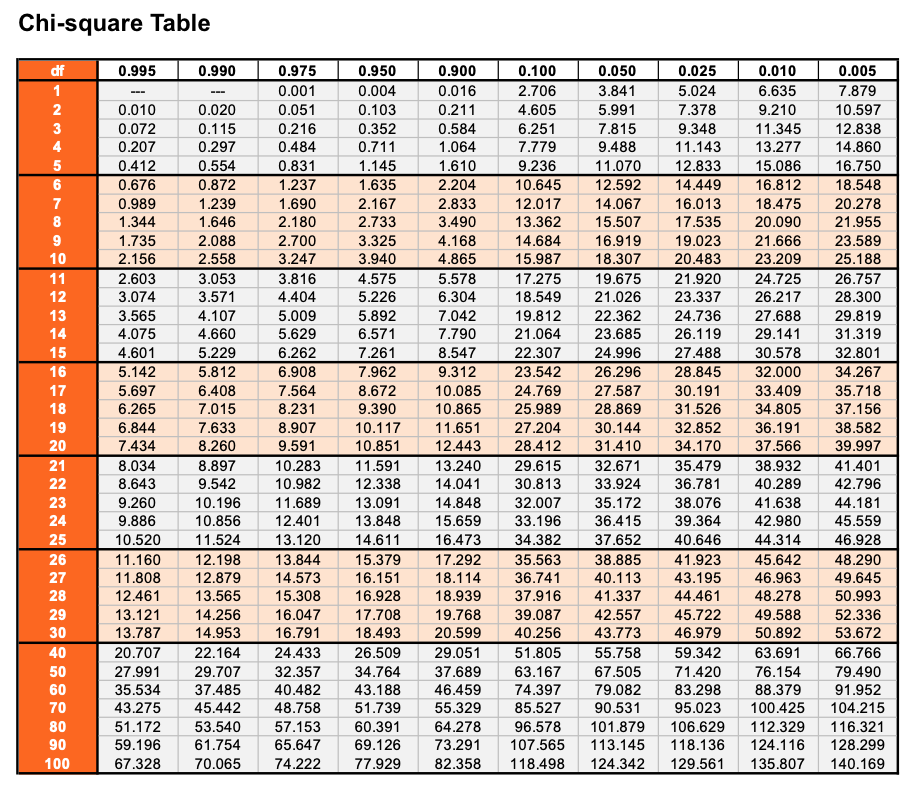
(c) At the 5% significance level, what is the critical value for the Chi-square test? [Use the Chi-square table]
Critical value CV(0.05,5) (using Chi-square table)
To reject Ho, the Chi-square test statistic must be greater than the CV (11.071).

Illustration:
(d) How do you conclude?
Since the test-statistic (2.8) is less than the critical value (11.071), we fail to reject and conclude that there is no evidence that this die is not fair.
Alternatively, for , the p-value is between 0.10 and 0.90, which is greater than 0.10 (using the Chi-square table).
[Using software, the exact p-value is 0.731.]
Since the p-value is greater than , we fail to reject and conclude that there is no evidence that this die is not fair. This is the same conclusion as above.
Suppose we toss a coin 100 times. Tails showed up more times than expected and heads showed up few time than expected.

(i) What is the Chi-square test statistic? [Provide answer with 2 decimal places.]

0:00 / 0:00
Chi-Square Test of Independence
A Chi-square Test of Independence are used to determine if there is a significant association between two categorical variables from a single population.
Examples
- Critters Bookstore is wondering if women more inclined to buy fantasy novels, whereas men are more inclined to buy non-fiction.
- Is area of study independent of gender?
- Are people in the South more inclined to vote Republican?
- Do people in Brazil have more positive views of plastic surgery than people in Norway?
Limitation of Chi-Square Test of Independence
1. The Chi-square test is only meant to test the independence of a distribution of data.
- It will not tell you anything about the relationship between the variables.
- For example, the Chi-square test will tell you that region is associated with party affiliation but it will not tell you how much more likely someone from the South will vote Republican than someone from the West.
- The Chi-square test statistic is always positive so the test statistic itself does not tell you if there is a negative association between two variables.
2. Both categories must be categorical data.
- You cannot use quantitative data.
- Suppose you want to test for independence between age and political party. Age is a quantitative variable so you cannot use that to perform Chi-square.
- However, you could convert age from quantitate to categorical: [young adult, middle age adult, senior]. Of course, your results vary based on where you cut off between the groups.
3. The variables you use must be mutually exclusive.
- There cannot be participation in more than one category.
- The data from all the cells must add up to the total count, and no item should be double-counted.
- For example, “birthplace” – one cannot be born in multiple countries.
To determine if there is a significant difference between two variables, we must calculate the expected frequencies and the observed frequencies in one or more categories.
Hypotheses:
There is no relationship (association) between the variables. (They are independent.)
There is a relationship (association) between the variables. (They are not independent.)
Wize Tip
The hypotheses in Chi-square tests are only words and, like all hypotheses, are statements about the population.
Test-statistic:
Watch Out!
Warning: Do not take the square root of .
The degrees of freedom
= # of rows
= # of columns
This is how you calculate the expected frequency,
Example

0:00 / 0:00
Example: Chi-Square Test for Independence
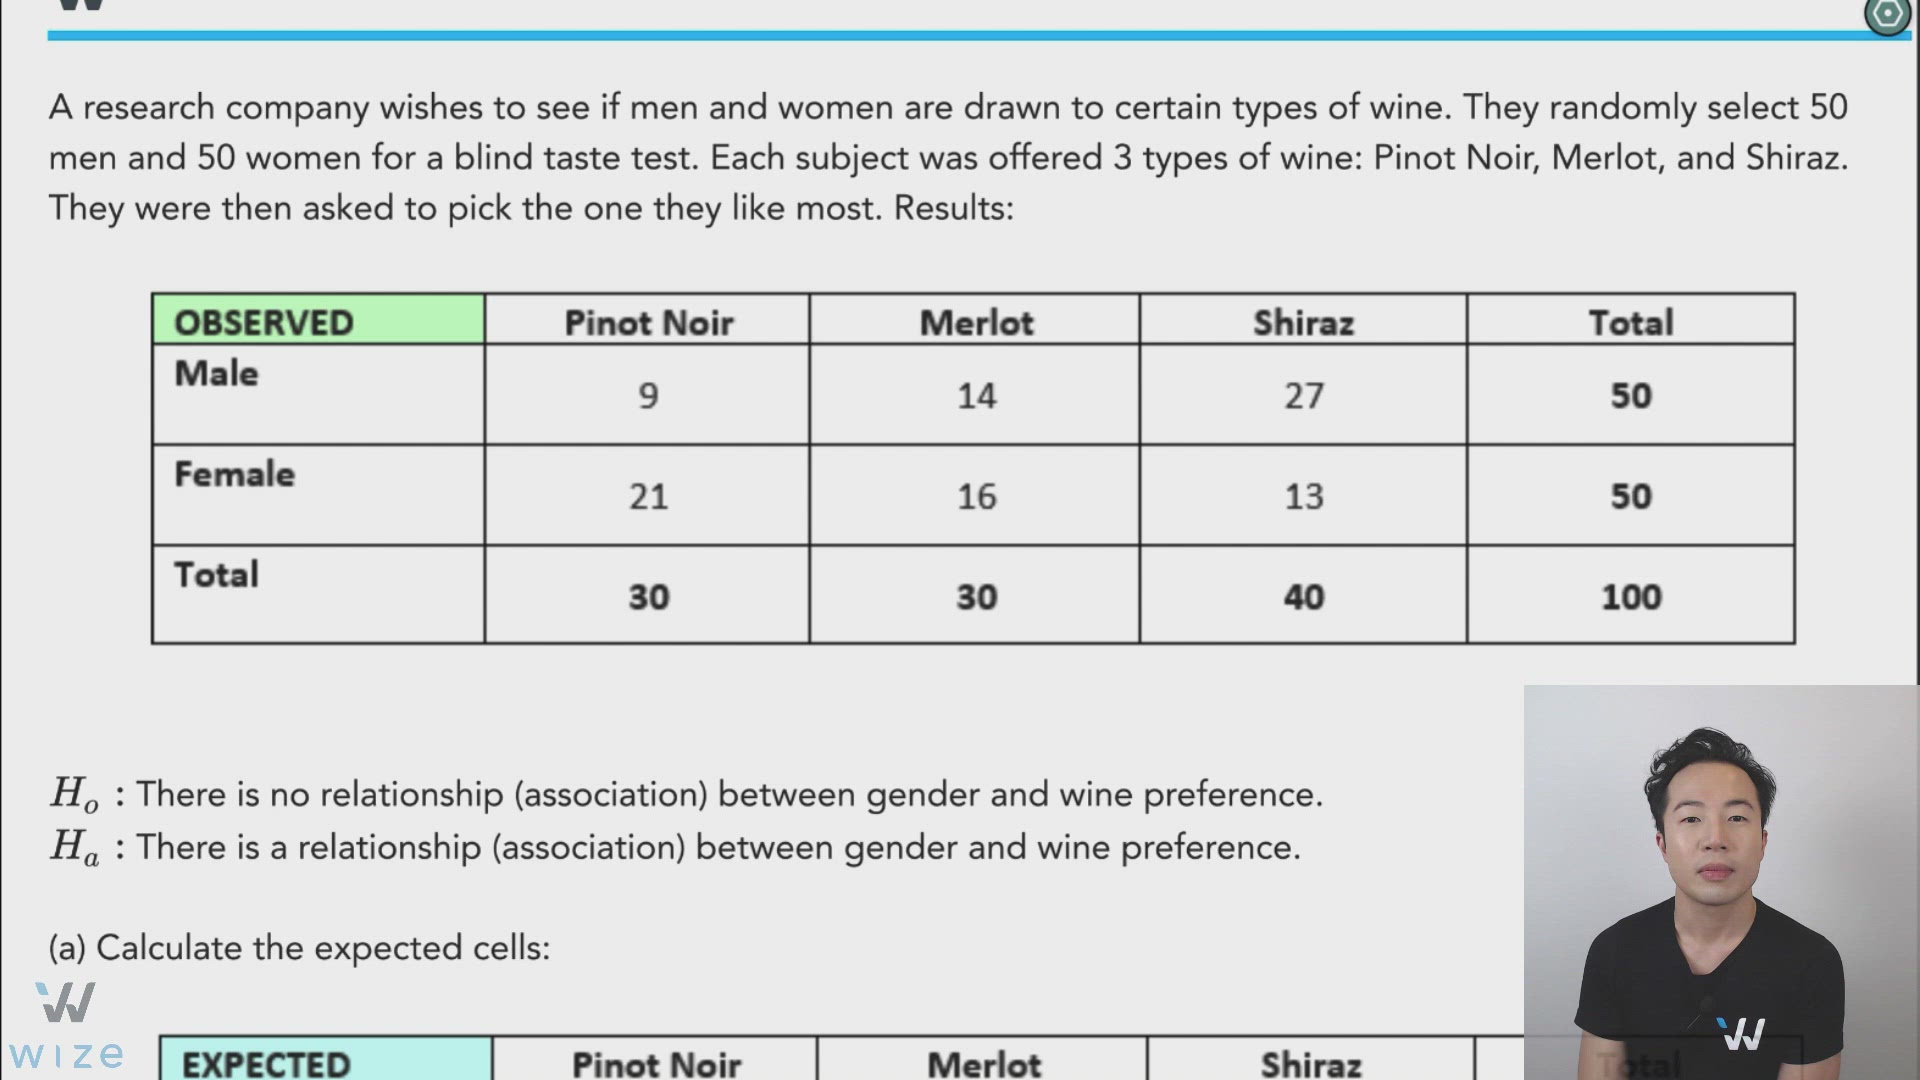
A research company wishes to see if men and women are drawn to certain types of wine. They randomly select 50 men and 50 women for a blind taste test. Each subject was offered 3 types of wine: Pinot Noir, Merlot, and Shiraz. They were then asked to pick the one they like most. Results:

There is no relationship (association) between gender and wine preference.
There is a relationship (association) between gender and wine preference.
(a) Calculate the expected cells:


(b) Find the Chi-square test statistic and its p-value (using Chi-square table).
We have and . Looking at the Chi Square Table, we see that our p-value is less than 0.01. [Using software, the exact p-value is 0.0073.]
(c) Draw your conclusion.
We reject/fail to reject there is/is no evidence of an association between gender and wine preference.
Reject; there is an association
Pick Meow is a shelter for cats in California. At the 1% significance level, is there a relationship between the ages of cats and whether they get adopted or not? Here are the results based on 100 randomly selected cats:

(a) Which of the following is the correct alternative hypothesis ? (Check all that applies.)

0:00 / 0:00
More on Chi-Square Tests
Expected values should not be too small
Small expected values could lead to misleading results.
Example
J. Kidding sells her romance novels online and at Chapters. She wishes to see if there is an association between gender and method of purchase of her books. She randomly samples 20 men and 200 women.
Results:

We calculate the expected values:

Notice that one cell in the expected value table is very small: {Men, Buy from Store} = 3.64.
See what happens to the
- As you can see, the {Men, Buy from Store} cell contributes to almost two-third of the score!
- This is because its expected value cell is very small. Small cells in the expected frequency table contribute to a disproportionately large amount to the test statistic.
- This could increase the probability of committing a Type I error!
The Chi-square test works best when each of the expected cell frequencies are at least 5
How can we try to fix small expected frequency cells?
1) Increase the sample size and hope that all the expected frequency cells become larger than 5. Note: the sample must still be randomly drawn - you cannot "cherry pick" to target small expected frequency cells.
2) Combine categories... only if it makes sense. For example, it would make little sense to combine wombats and humans into one category (but it depends on the study). Also, if your row or column variables only have 2 categories, then combining them into one would make the degrees of freedom equal to 0, which wouldn't make your Chi-square test work.
Suppose that we have 4 categories A, B, C and D and while calculating the expected frequencies we have:
Category Expected Frequency
A 4
B 3
C 7
D 8
Cells with expected frequencies below 5 could be merged together (collapsed) for the chi-square test to be valid.
In this case we would use 3 instead of 4 categories as follows:
Category Expected Frequency
A,B 7
C 7
D 8
You then proceed as usual with new degrees of freedom