Wize AP Statistics Textbook > Inference for Two Population Proportions
Confidence Interval for Two Proportions

0:00 / 0:00
Confidence Interval for Differences in Population Proportions
To make inferences about the difference in the population proportions (parameter), we use the difference in the sample proportions .
Wize Tip
Review Confidence Intervals if you need a refresher. (See: Estimating with Confidence Intervals)
We do not know the actual value of the difference in population proportions but we can provide a reasonable range to estimate it, by constructing confidence intervals given a certain confidence level (e.g. 90%, 95%, 99%). Like all confidence interval, it is constructed using a point estimate plus or minus a margin of error.
When comparing two proportions, the point estimate (or statistic) is .
Example
We wish to estimate the difference in the percentage of international students at U of A (Population 1) and U of B (Population 2).
- The parameter that we are trying to estimate is .
- is unkown
- is unkown
- Therefore, the difference is unkown.
Suppose we draw samples from each population. Results:
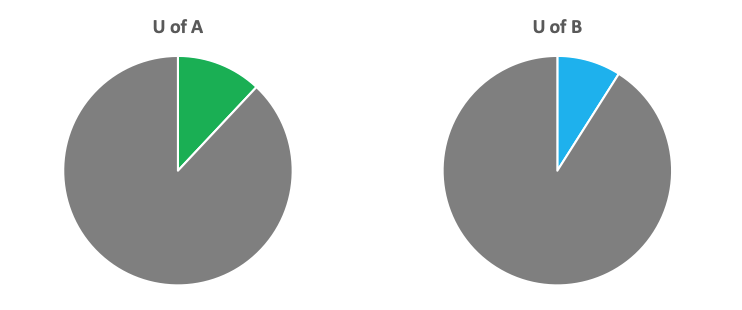
- The proportion of international students in Sample 1 is
- The proportion of international students in Sample 2 is
- The point estimate or statistic is
- We estimate that the true difference in proportions is 0.03 (or 3%).
The above is just a point estimate. Suppose we construct a 95% confidence interval. Results:
- 0.01 is the lower confidence level (LCL)
- 0.05 is the upper confidence level (UCL)
- We are 95% confident that the true difference in proportion of international students is between 0.01 and 0.05.
- We do not know the value of the true difference in proportions but we are very confident that it is somewhere within that confidence interval.

0:00 / 0:00
Confidence Interval for Two Proportions
where,
- the standard error of the statistic is
We make inferences with confidence intervals.
Wize Concept
If the confidence interval does not contain "0", then there is evidence that the two population proportions differ.
If the interval contains "0", then there is no evidence that the two population proportions differ.

0:00 / 0:00
Example: Confidence Interval for Two Proportions
Based on a random sample of 50 male professors, 26 of them voted in favor of electing a new president. Based on a random sample of 40 female professors, 12 of them voted in favor.
(a) Solve for and :
(b) Construct a 95% confidence interval for the difference in the proportions of male and female professors who are in favor of electing a new president. Interpret it (in plain English).
We use:
We need to find :

We are 95% confident that the difference in the proportions of male and female professors who are in favor of electing a new president is between 2% and 42%. Specifically, there is a greater proportion of male professors who are in favor.
(c) Does the interval contain "0"? Interpret that that means.
The interval does not contain "0". This means that one group (specifically the male professors) is consistently different (specifically greater) than the other group (specifically the female professors) for being in favor of electing a new president.
Based on a random sample of 40 students who live on campus (Population 1), 16 of them say get enough sleep. Based on a random sample of 32 students who live off campus (Population 2), 10 of them say get enough sleep.
Construct a 99% confidence interval to estimate the difference in the proportions of students who live on campus and off campus who say they get enough sleep.
(i) What is the point estimate?