Boxplots and Five Number Summary
Five Number Summary
The five number summary provides a quick summary of the center and variability of a data set.
Boxplot
A boxplot is used to display how quantitative data is distributed, and gives you an idea of the spread and skewness of the data. It also lets you check for outliers (extreme values).
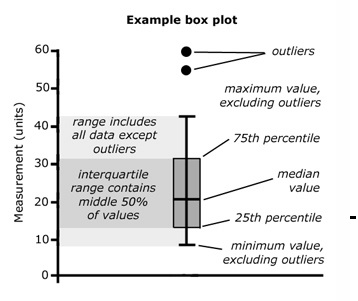
A boxplot includes the 5-number summary and, if any, outliers:
- small outliers (if any)
- lowest non-outlier
- Q1
- Median
- Q3
- highest non-outlier
- large outliers (if any)
Notes
- Outliers are shown as separate dots.
- The “whiskers” extend up to the largest observation and down to the smallest observation that are not identified as outliers.
- Boxplots are also useful when comparing two or more distributions.
Outliers
A value is an outlier if it is outside the inner fence:
Or
For extreme outliers outside the outer fence, use 3 instead of 1.5 in the equations:
Or