Popular Courses
COMM 214
Concordia University
STAT 151
University of Alberta
AP Statistics Exam Prep Course
AP Exam Prep
Statistics
General Course
Intro to Statistics
University Study Guides
COMM 215
Concordia University
Algebra I
US High School
STAT 213
University of Calgary
COMM 191
University of British Columbia
DATASCI 1000A/B
Western University
STA 100
University of California - Davis
Grade 12 Data Management
Ontario High School
High School Statistics
US High School
STATS 2244A/B
Western University
STAT 200
University of British Columbia
Intro to Statistics
University Study Guides
STATS 2035
Western University
STAT 161
University of Alberta
QMS 210
Toronto Metropolitan University
STAT 263
Queen's University

0:00 / 0:00
Histograms
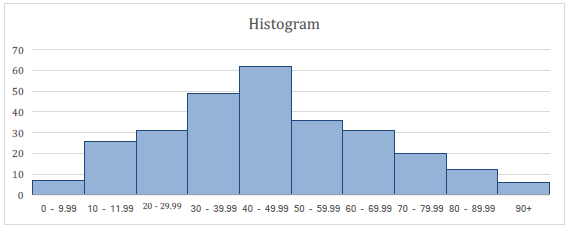
A histogram is a useful graph that show the frequency (or counts) of quantitative data, sorted in class intervals or bins.
Watch Out!
Do not confuse a histogram with a bar chart, which is used to showcase categorical data.
A histogram is is a very common graph used to let us see the spread, center, and shape of a distribution of one quantitative variable.
Spread
- What’s the range (i.e. max – min)?
- Does the data cover a large or small range of values?
- This is important when comparing two or more histograms.
Center
- Locate the middle. Where is it?
- The mean and median are both are measures of center. The location of the mean and median depends on the shape.
Shape
- Is the distribution symmetric, skewed, or has no clear shape?
Other observations
- Any gaps? Gaps are empty bins where the frequency is zero.
- Outliers? Outliers are extreme values that a far from the rest of the distribution at either side of the histogram.
- Peaks/modes?
- Unimodal, bimodal, or multimodal?
There are four sections in STAT 100, each with 54 students. The distributions of grades for each section are shown below in histograms.
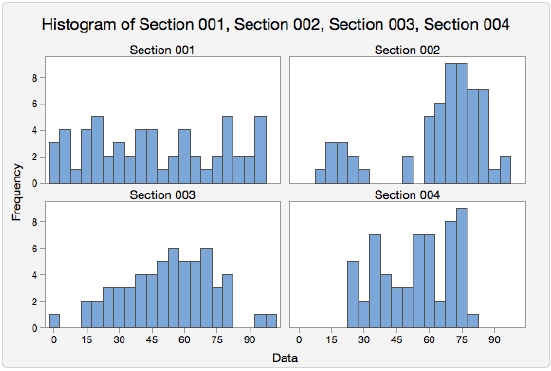
Which distribution has the highest median grade?
There are four sections in COMM 499, each with 54 students. The distributions of grades for each section are shown below in histograms.
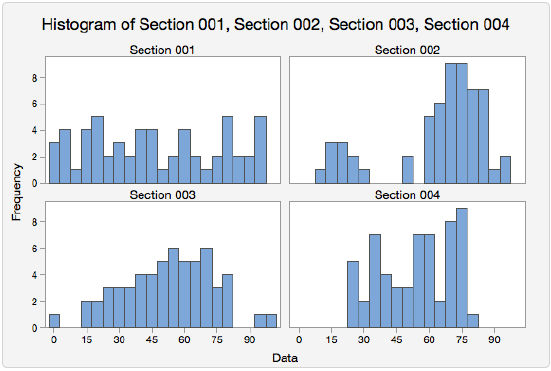
Which distribution shows the greatest variability in grades?
Practice: Histogram
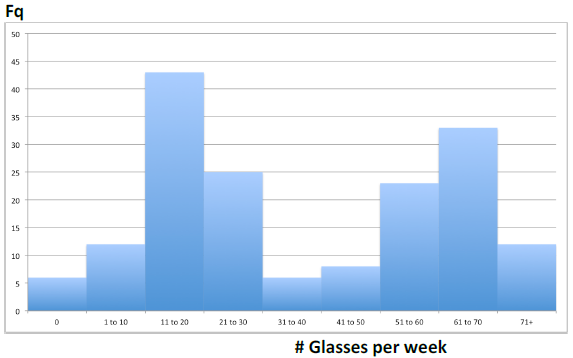
Below is a histogram showing how many glasses of water a person drinks per week (n=168). Which of the following is true? [Select all that apply]