Create a free account to get started

Unlock full course notes by signing up

  • Video lessons taught by top educators
  • Practice questions with guided solutions
  • Written review notes for reference
  • Expert answers anytime from course tutors

Stemplots (Stem-and-Leaf Plots)

A stemplot is used to display quantitative data, allowing us to describe the range, median, and skewness. In some cases, outliers could be observed.

  • It is usually made from a small set of data (probably no more than 50 or else it would be very time-consuming to create by hand).
  • If you have a large dataset and have access to software, then you should construct a histogram instead.


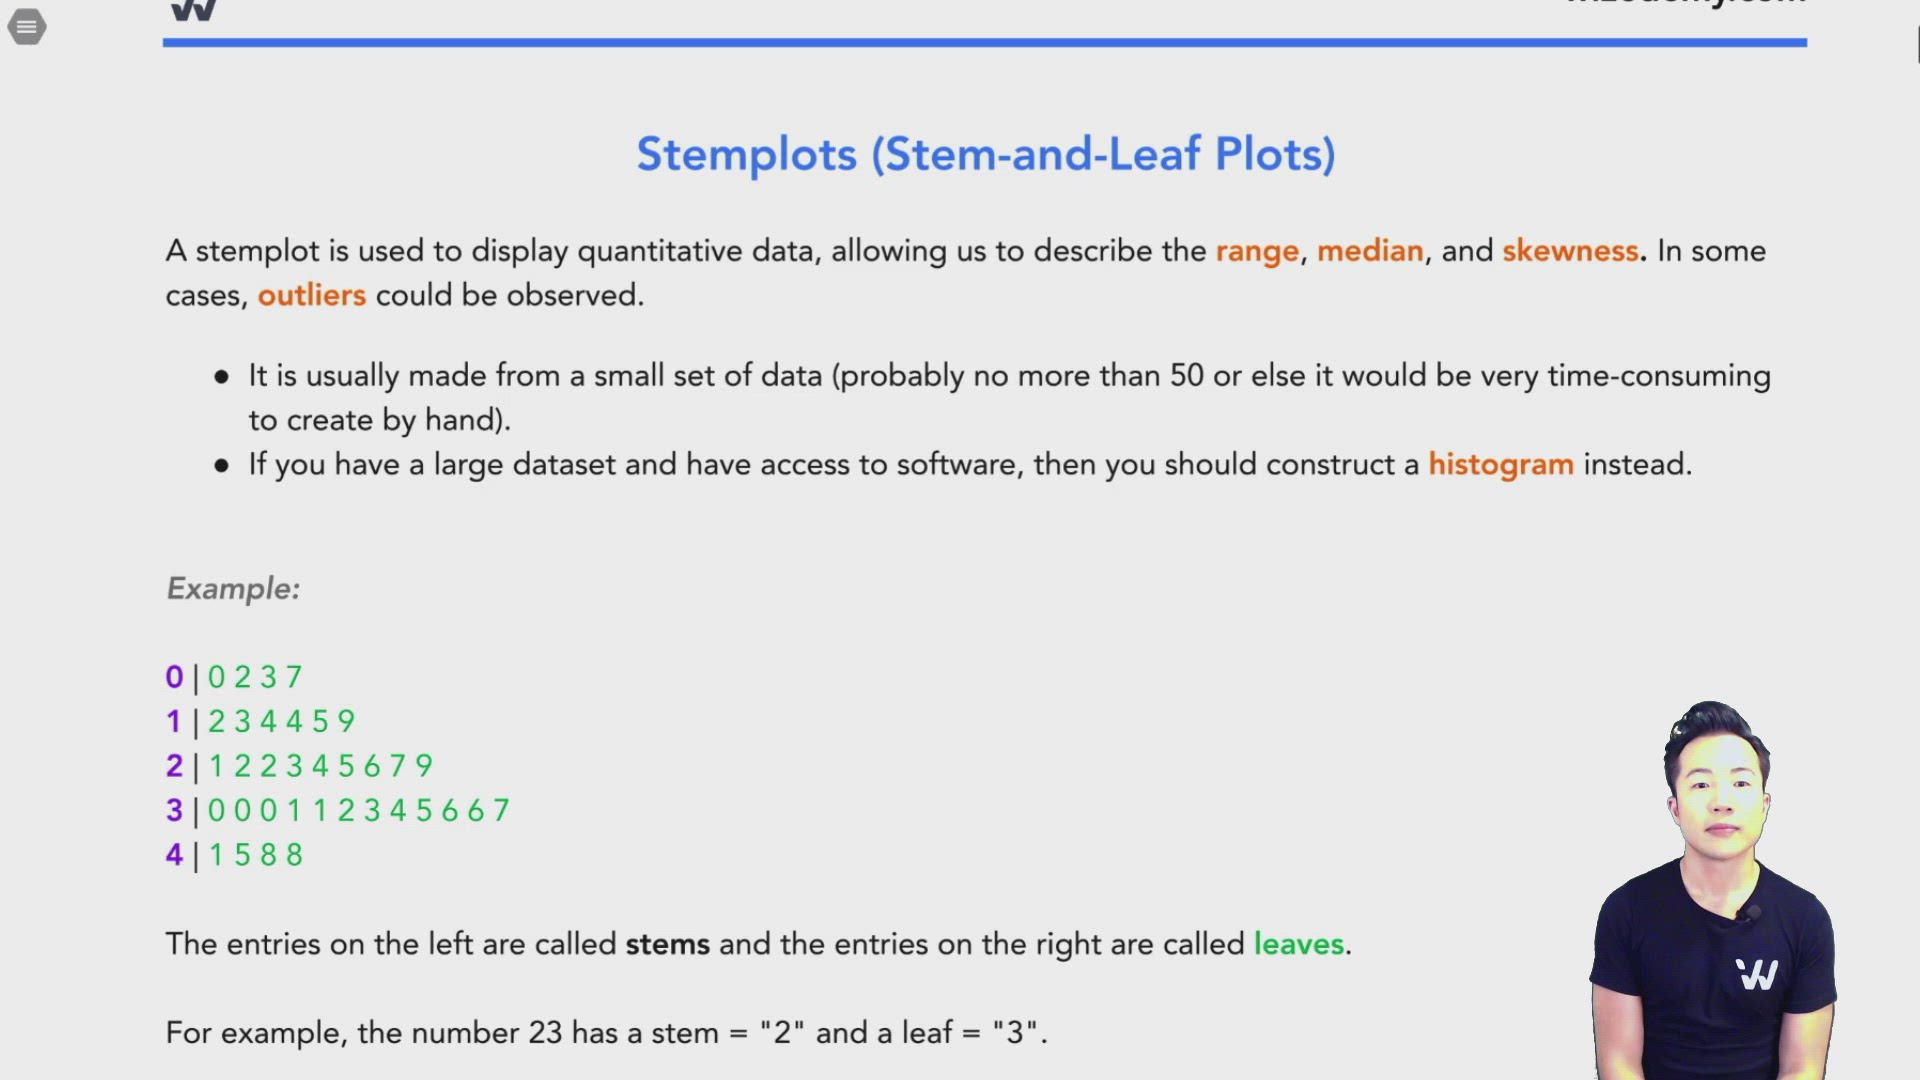
Example:


0 | 0 2 3 7

1 | 2 3 4 4 5 9

2 | 1 2 2 3 4 5 6 7 9

3 | 0 0 0 1 1 2 3 4 5 6 6 7

4 | 1 5 8 8


The entries on the left are called stems and the entries on the right are called leaves.


For example, the number 23 has a stem = "2" and a leaf = "3".

The stemplot below shows the number of text messages a teenager sends a Saturday. Here, stems are tens; leaves are ones, which means a 2-stem and 6-leaf = 26 text messages.


8| 2
7|
6| 0 1
5| 2 2
4| 1 5 6
3| 2 7 8 8
2| 1 3 6 7 8
1| 2 5 7
0| 5


True of false?

Your answers

Create a free account to get started

Unlock full course notes by signing up

  • Video lessons taught by top educators
  • Practice questions with guided solutions
  • Written review notes for reference
  • Expert answers anytime from course tutors