Time Series Plots
A time series plot displays quantitative values against an interval of time. It allows you to observe any seasonality (ups and downs within time periods) or trends over time.
- On the x-axis we plot the time increments or date
- On the y-axis we plot the quantitive value measured
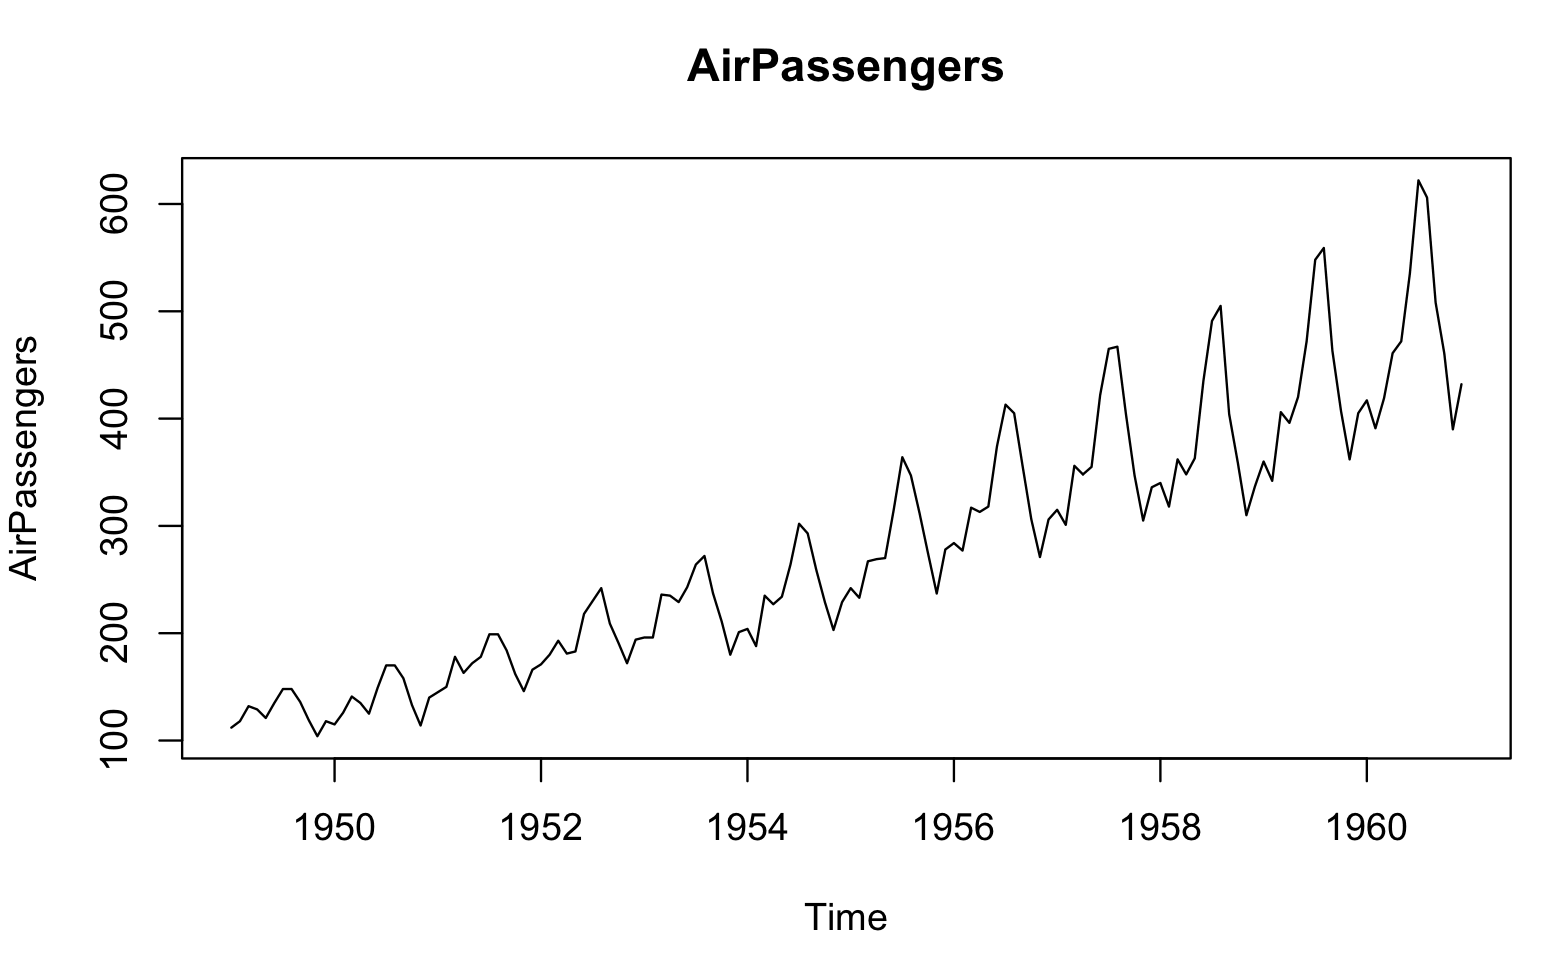
What two things do you observe in the above time series plot?
1. Seasonality
2. Upward trend over time