
Solving Polynomial Inequalities Using a Graph
A polynomial inequality can be solved in similar ways the polynomial equations are solved.
Step 1.
Factor the polynomial.
Step 2.
Identify the x-intercepts and graph the polynomial.
Step 3.
Identify the intervals where the polynomial exists to satisfy the inequality.
Step 4.
Express the answer in an appropriate format.
Example
Solve by graphing. Express the solution in set notation.
Step 1.
Let .
The quotient becomes .
So,
Step 2.
X-intercepts:
Graph:
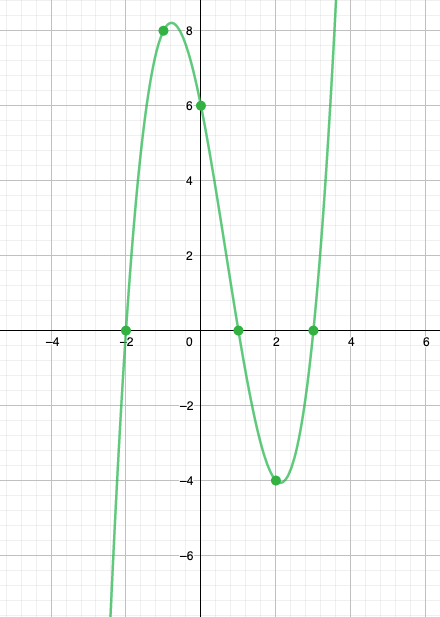
Step 3.
The polynomial is less than or equals to 0. Thus, we want the part of the polynomial that lies below the line y = 0 (the x-axis).
The intervals where the polynomial is less than 0 are
Step 4.
in set notation is:
.
Example: Solving Polynomial Inequalities Using a Graph
Solve by graphing. Express the solution in interval notation.
Step 1.
Let .
The quotient becomes .
So,
Step 2.
X-intercepts:
Graph:
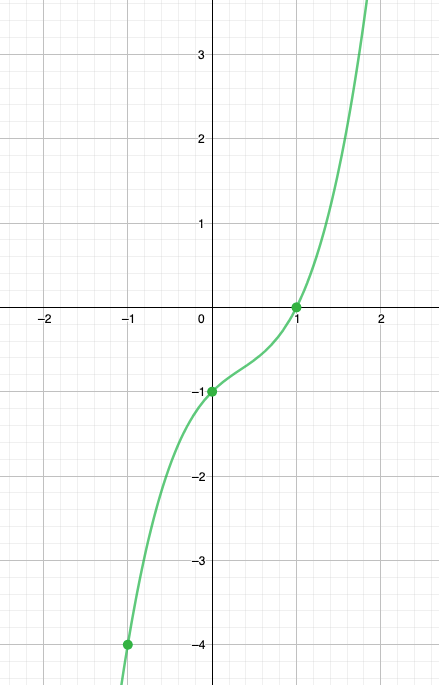
Step 3.
The polynomial is greater than or equals to 0. Thus, we want the part of the polynomial that lies above the line y = 0 (the x-axis).
The interval where the polynomial is greater than 0 is
Step 4.