
Sampling Variability & Sampling Distribution
There are two main population parameters and sample statistics that we are very interested in:
- For numerical data: we want to estimate the population mean using the sample mean
- Example We want to know the mean height of all students attending WIZE university, so we calculate the mean height of samples of students.
- For categorical data: we want to estimate the population proportion using the sample proportion
- Example We want to know the proportion of all students attending WIZE university who are vegetarians, so we calculate the proportion of vegetarians in samples of students.
Sampling Variability
If we keep on taking samples of size from our population of size , the sample statistic that we calculate from sample to sample will vary -- this is known as sampling variability.
Results are more reliable when the sampling variability is small.
Size Matters
When we draw a sample from a population and then draw another sample, the two samples’ statistics may vary. How much it varies depends on the sample size.
This is because as the sample size increases, the effect of extreme values (outliers) decreases and the observed values for the statistic will group more closely (see: Central Limit Theorem).
Sampling Distribution
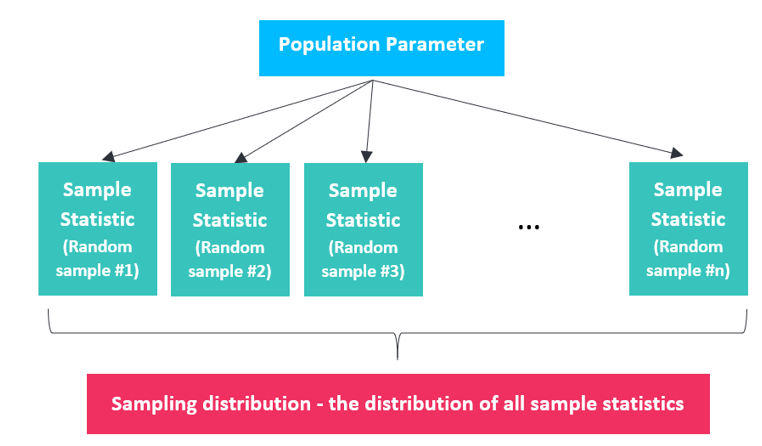
The distribution of the sample statistics that we calculate from all possible samples of size is known as the sampling distribution.
Standard Error
The standard error is a very important but confusing term. It is also known as:
- The estimate of the standard deviation of the sampling distribution.
- The standard deviation of the sample mean (or standard deviation of the sample proportion).
The standard error is used in confidence intervals and hypothesis testing where we use our sample statistics to make inferences about the population parameters.
Example
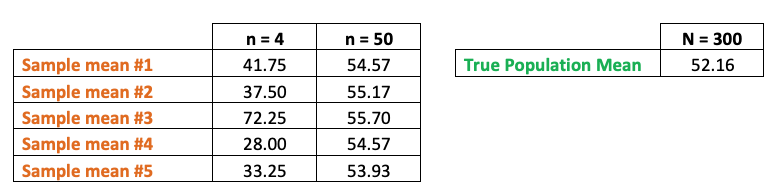
We want to estimate the average midterm grade of all STAT 100 students .
- Hailey randomly surveyed students (small sample size),
- Logan randomly surveyed students (large sample size).
- They each repeated the sampling process 5 times and recorded the sample mean each time.
Results:
What do you notice?
- The results vary a lot when the sample size is small large standard error
- The results vary only a little when the sample size is large small standard error
- Neither Hailey nor Logan correctly guessed the true population mean , but we are more confident with Logan's estimates!