Wize High School Algebra II Textbook (Common Core) > Sampling and Estimating
Sampling Distribution for a Mean

0:00 / 0:00
Central Limit Theorem (CLT)
The Central Limit Theorem (CLT) describes the relationship between the sampling distribution of sample means and the population that the samples are drawn from.
Suppose you are drawing samples of size from a population of size , which has mean and standard deviation .
The CLT basically says that "for large sample sizes, the sampling distribution of any sample mean becomes close to a normal distribution."

What Does the CLT Formally Tell Us?
If the following conditions are met:
- the samples are randomly drawn from the population (SRS), and
- the sample size is sufficiently large (some textbooks say some say )
then, the CLT tells us two things:
- If the population is normally distributed, then the sampling distribution of the sample mean is exactly normal.

- If the population is NOT normally distributed, then the sampling distribution of the sample mean will be approximately normal. Note: As you increase the sample size, the shape of the sampling distribution will look more and more normal.

Wize Tip
With skewed populations the distribution of the sample mean will be approximately normal if .
If , the distribution will be non-normal, skewed in the same direction as the population.
Mean & Standard Deviation of the Sample Mean
If is large enough (), then the CLT tells us that the sampling distribution of the sample mean is approximately normal.
So, we have the following two properties:
- The mean of the sample mean = population mean
- The standard deviation of the sample mean = population standard deviation divided by the square root of
0:00 / 0:00
Sampling Distribution for a Mean
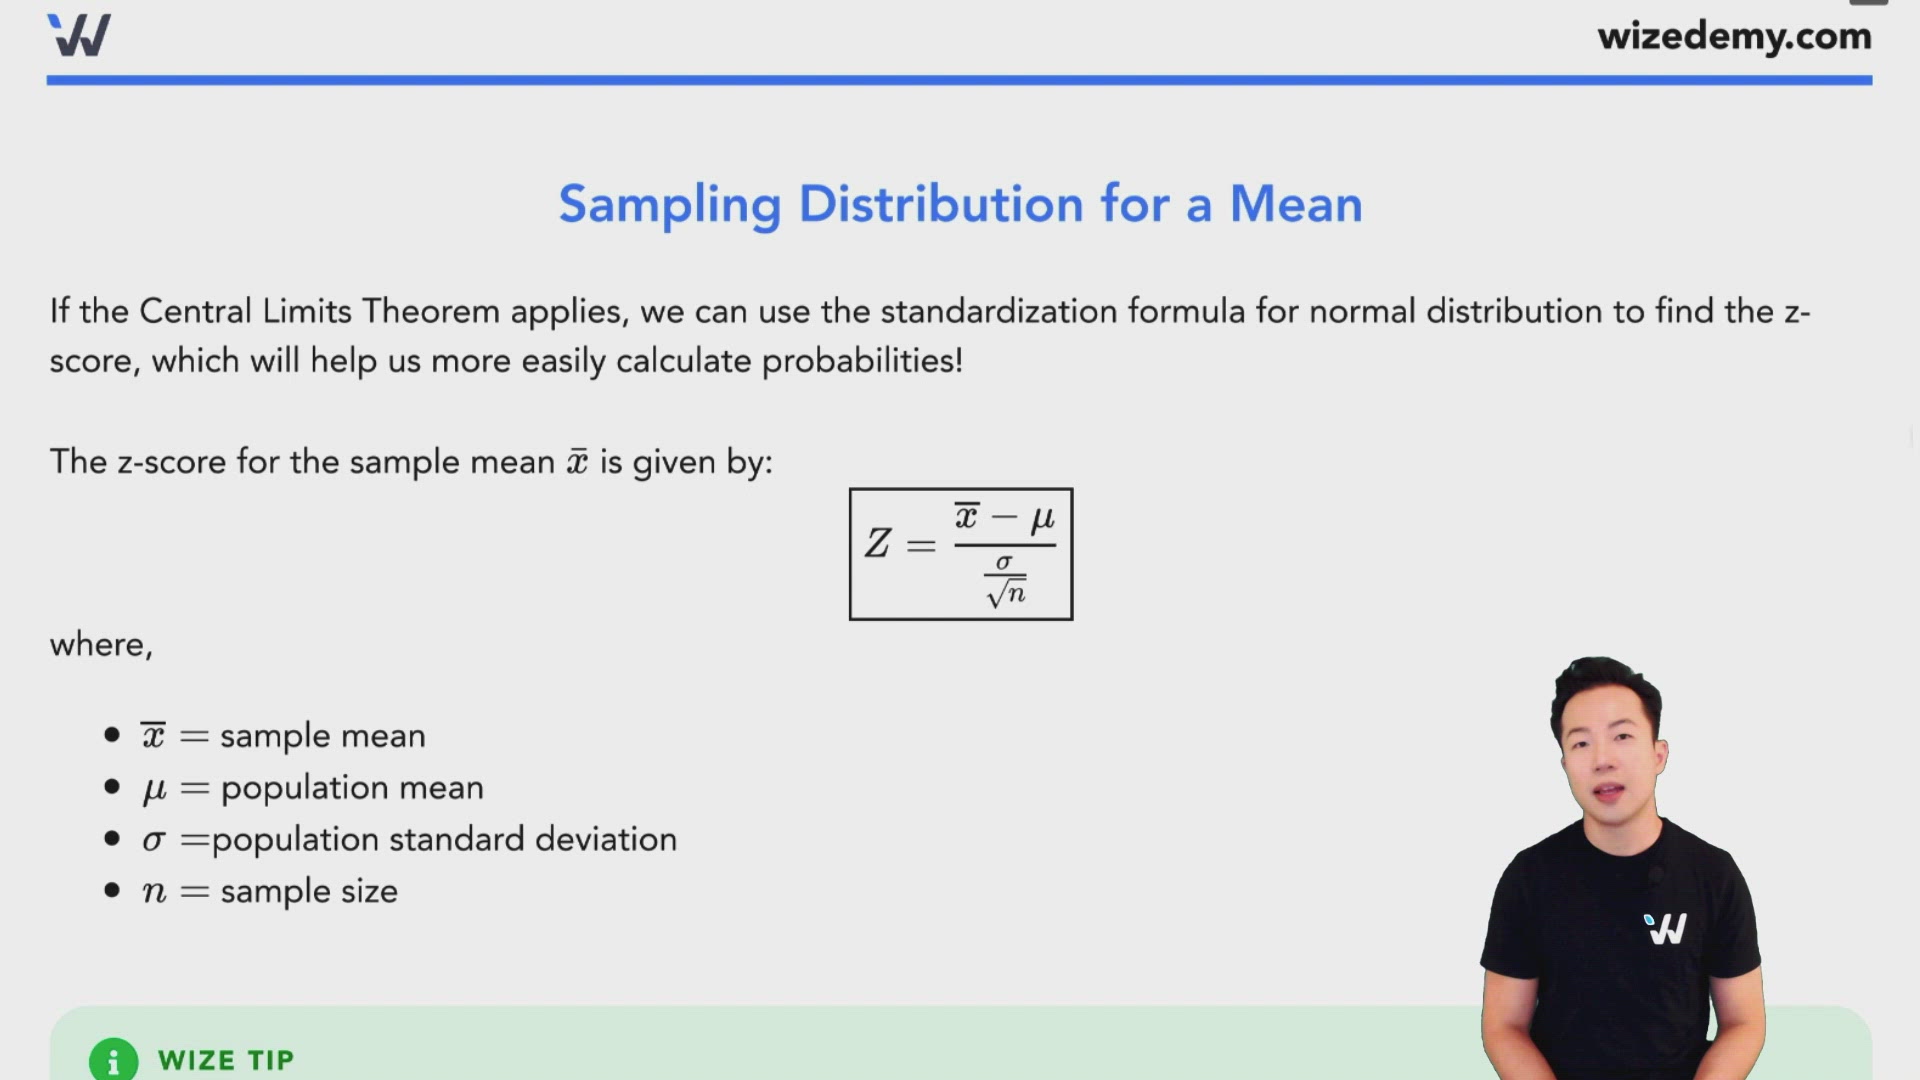
If the Central Limits Theorem applies, we can use the standardization formula for normal distribution to find the z-score, which will help us more easily calculate probabilities!
The z-score for the sample mean is given by:
where,
- sample mean
- population mean
- population standard deviation
- sample size
Wize Tip
If you are being asked about a single observation, use
If you are being asked about the mean of a sample, use

0:00 / 0:00
Example: Sampling Distribution for a Mean
Random bags of potatoes weigh on average 10 pounds and have a variance of 0.64.
= 10, = 0.80
1. If you randomly select a bag of potatoes, what is the probability that it will weigh more than 8.2 pounds?
The question is asking about a single observation, let's use the formula.
Using the z-table, we get
Therefore,
2. If you randomly select 25 bags of potatoes, what is the probability that their average weight will be between 9.7 and 10.4 pounds?
The question is asking about the mean (average) of a sample, let's use the formula.
Using the z-table, we get
Using the z-table, we get
Therefore,
Note: Some courses require for CLT to hold. If this is required in your class, then a sample size of 25 is not enough. You can still do this question for practice.
3. If you randomly select 81 bags of potatoes, what is the probability that their total weight will be at least 828 pounds?
A total weight of at least 828 means that their average is at least .
The question is asking about the mean (average) of a sample, let's use the formula.
Using the z-table, we get
Therefore,
4. If you randomly select 10 potatoes, is there enough info to find the probability that their average is under 9.5 pounds?
Since < 25, Central Limit Theorem doesn't apply, we need a normal population to proceed. Since we don’t have that information we can’t proceed to answer this question.
Sony is interested in the number of songs on a person’s iPhone. The population distribution of songs is normal with a mean of 300 and a standard deviation of 60.
(a) What’s the probability that a random iPhone will have more than 375 songs?
(b) If Sony randomly samples 12 iPhones, what’s the probability that the sample mean will be more than 375 songs?
(c) Explain why the probabilities differ so much.
(a) What’s the probability that a random iPhone will have more than 375 songs?