
Confidence Interval for a Mean
There are two formulas used to construct confidence intervals for a mean. Which formula to use depends on whether population standard deviation is known or not.
When the Population Standard Deviation is KNOWN
When is known and the conditions for a valid confidence interval are satisfied, the confidence interval for the population mean is
However, since we are trying to estimate the population mean, which is unknown, it is not realistic to know the population standard deviation .
When the Population Standard Deviation is UNKNOWN
Since we are trying to estimate the population mean, which is unknown, it is not realistic to know the population standard deviation . In this case, the confidence interval for the population mean is
where,
- is the sample standard deviation
- is the multiplier or critical value from the t-distribution with degrees of freedom
What is the difference between a z-distribution and a t-distribution?
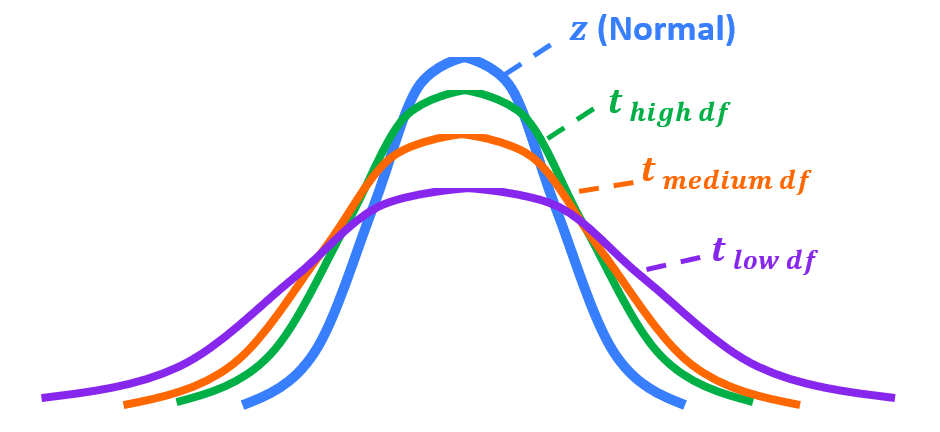
Finding the critical value, :
Example 1
If we sample 19 people and want to construct a 95% confidence interval, what is the critical value, ?
- Step 1: the degree of freedom is: found on the left column of the t-table
- Step 2: locate the confidence level at the bottom row of the t-table, in particular 95%.
- Step 3: determine the critical value, .

Example 2
Based on a random sample of 30 households in Yaletown, the average utility bill is $140 is per month with a standard deviation of $75 per month. Construct a 90% confidence interval for the average utility bill for all households in Yaletown.
- Population: ________
- Sample: ________
- Parameter: ________
- Statistic: ________
Step 1: Find the degrees of freedom:
Step 2: Locate the confidence level in the t-table
90% confidence level C
Step 3: Find :
For a 90% confidence interval,
Interpretation of a confidence interval
- CORRECT: “We are 90% confident that the true average utility bill for all households in Yaletown is between $117 and $163 per month.”
- WRONG: “About 90% of households in Yaletown had utility bills between $117 and $163 per month.”
- WRONG: “There is a 90% probability that the true average utility bill is between $117 and $163 per month per month.”
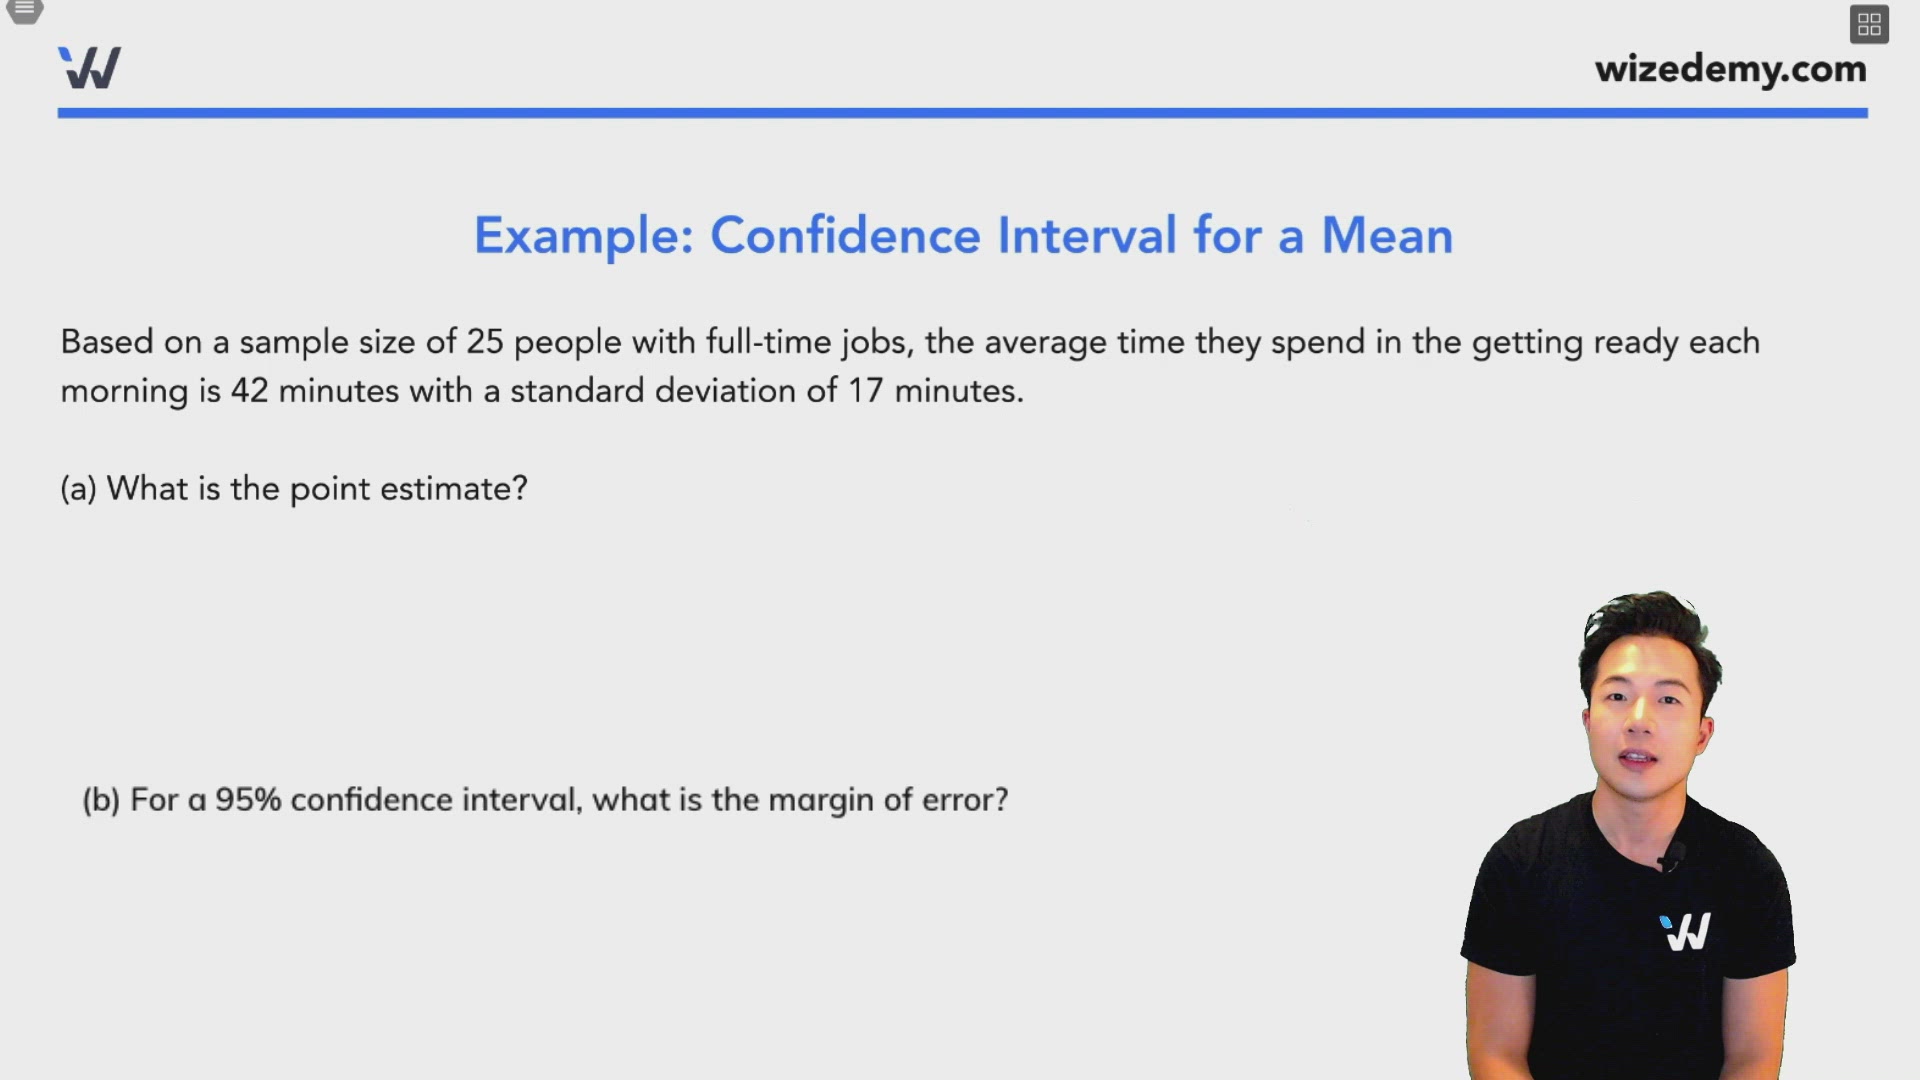
Example: Confidence Interval for a Mean
Based on a sample size of 25 people with full-time jobs, the average time they spend in the getting ready each morning is 42 minutes with a standard deviation of 17 minutes.
(a) What is the point estimate?
The point estimate is the sample statistic. In this case, it is the sample mean:
(b) For a 95% confidence interval, what is the margin of error?
Using t-table:

(c) Construct a 95% confidence interval and interpret it in simple English.
We are 95% confident that the average time people with full-time jobs spend getting ready each morning is between 35 and 49 minutes.