Create a free account to get started

Unlock full course notes by signing up

  • Video lessons taught by top educators
  • Practice questions with guided solutions
  • Written review notes for reference
  • Expert answers anytime from course tutors

Confidence Interval for a Proportion

The population proportion pp is the parameter we are trying to estimate using the sample proportion p^\hat{p}, which is the statistic or estimate.


The confidence intervals used to estimate the population proportion pp is


p^±z∗p^q^n\boxed{\displaystyle\hat{p}\pm z^{\ast}\sqrt{ \frac{\hat{p}\hat{q}}{n}}}


where,

  • q^=1−p^\hat q=1-\hat p
  • z∗p^q^n\displaystyle z^{\ast}\sqrt{ \frac{\hat{p}\hat{q}}{n}} is the margin of error.


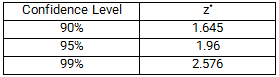
The confidence level corresponds to its z∗z^{\ast} “multiplier” value:


Image illustrating Confidence Interval for a Proportion


Finding z∗\colorOne{z^{\ast}} using the z-table:


Image illustrating Confidence Interval for a Proportion


Image illustrating Confidence Interval for a Proportion


Finding z∗\colorOne{z^{\ast}} using the t-table:

Image illustrating Confidence Interval for a Proportion


Image illustrating Confidence Interval for a Proportion


Create a free account to get started

Unlock full course notes by signing up

  • Video lessons taught by top educators
  • Practice questions with guided solutions
  • Written review notes for reference
  • Expert answers anytime from course tutors

Example: Confidence Interval for a Proportion

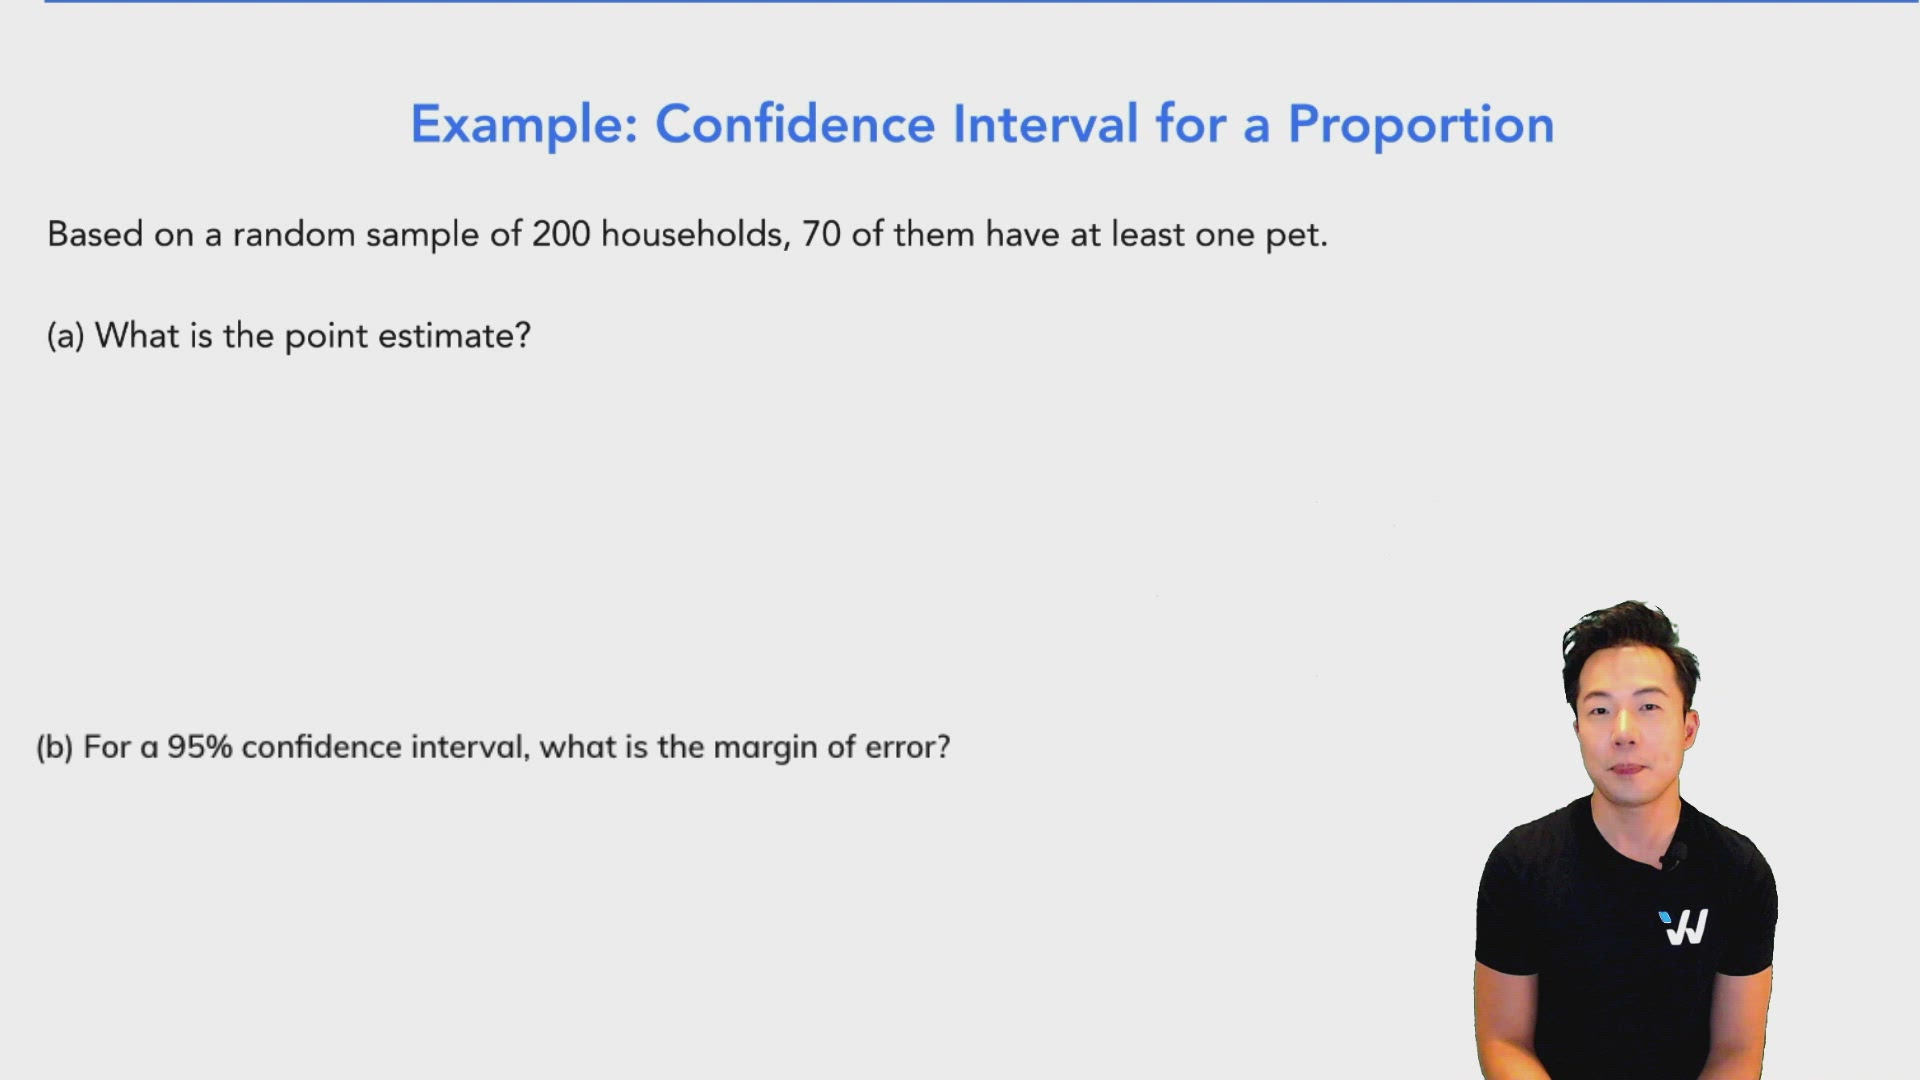
Based on a random sample of 200 households, 70 of them have at least one pet.


(a) What is the point estimate?


The point estimate is the sample statistic. In this case, it is the sample proportion:


p^=70200=0.35\hat{p}=\frac{70}{200}=0.35


(b) For a 95% confidence interval, what is the margin of error?


Image illustrating Example


z⋅=1.96z^{\cdot}=1.96

z∗p^q^n=1.96(0.35)(0.65)200=0.0661z^{\ast}\sqrt{ \frac{\hat{p}\hat{q}}{n}}=1.96\sqrt{\frac{\left(0.35\right)\left(0.65\right)}{200}}=0.0661


Image illustrating Example


(c) Construct a 95% confidence interval for households that has pets.


p^±z∗p^q^n\hat p \pm z^{\ast}\sqrt{ \frac{\hat{p}\hat{q}}{n}}

0.35±0.06610.35 \pm 0.0661


[0.2839, 0.4161]\left[0.2839,\ 0.4161\right]


We are 95% confident that between 28.39% and 41.61% of all households have pets.


A random sample of 1000 people in Calgary were asked if they are satisfied with their mobile carriers: “YES or NO?” Results: 535 people said YES.

Construct a 95% confidence interval and interpret it in simple English.

Your answers

Create a free account to get started

Unlock full course notes by signing up

  • Video lessons taught by top educators
  • Practice questions with guided solutions
  • Written review notes for reference
  • Expert answers anytime from course tutors