Wize High School Grade 11 Math Textbook > Inequalities
Solving Inequalities in Two Variables
Popular Courses
MATH 208
Concordia University
Grade 11 Math
Canada High School
Math 20-1
Alberta High School
QMS 110
Toronto Metropolitan University
MATH 157
Simon Fraser University
SC/MATH 1300 3.00
York University
MATH-1980
University of Windsor
MATH 1314
Tarrant County College District
MTH 116
Michigan State University
MATH 1302
University of Texas at Arlington

0:00 / 0:00
Solving Linear Inequalities in Two Variables
A linear inequality in two variables looks something like this: .
*The inequality can be any one of .
The solution to an inequality in two variables is an entire region!
Example
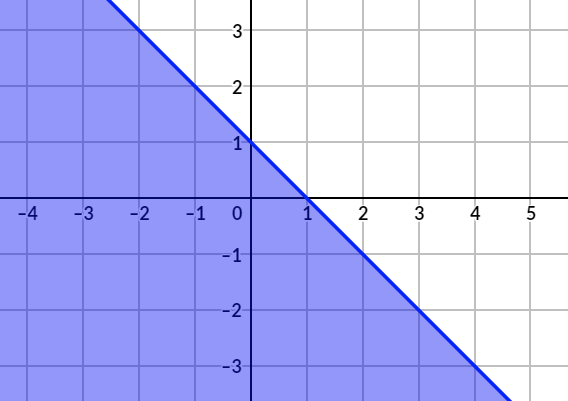
The solution region of is the darker region of the plane:
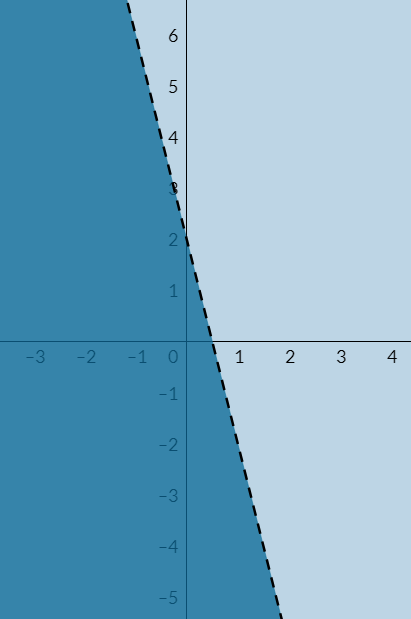
The line in this image is called a boundary. Its equation can be found by solving for .
So the line itself is given by , but since is less than the expression for the line, we shade in the region below.
Wize Tip
Notice that the line is dashed. This is used whenever the inequality involves or .
The line is solid when working with or .
Every point in the shaded region satisfies the inequality! (Not including the dashed boundary line.)
Check: Use a test point in the solution region and plug it into the inequality. We can use the origin in this case.
The original inquality states , and since , our solution region does indeed contain the test point!
0:00 / 0:00
Example: Solving Linear Inequalities in Two Variables
Consider the linear inequality .
a) Solve for .
Watch Out!
Always be sure to change the direction of the inequality when multiplying or dividing by a negative number!
b) Graph the solution region.
Start by graphing the boundary line (change the inequality into an equality):
Note: Since the inequality is (and not equal to), the boundary line is dashed.
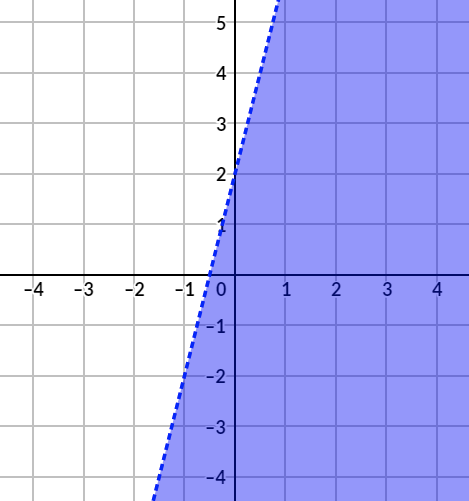
We shade the region below the boundary line since we ended up with "" in our result from Part a).
c) Does the point satisfy the inequality?
Method 1: Graph
Looking at the graph, the point falls in the solution region, so it does satisfy the inequality.
Method 2: Using the Inequality
We can check using the original inequality or the one found in Part a).
Using and substituting the coordinates :
and since , the inequality is satisfied.
Practice: Solving Linear Inequalities in Two Variables
Select all of the coordinates that satisfy the inequality:
Practice: Solving Linear Inequalities in Two Variables

Chen's current company pays him .
He can instead start freelancing and earn and an additional for every contract he accepts.
Write an inequality comparing these options if Chen wants the switch to freelancing to make him at least as much money as his current job.
Use the variable for the number of hours, and for the number of contracts.

0:00 / 0:00
Solving Quadratic Inequalities in Two Variables
A quadratic inequality in two variables looks something like this: .
*The inequality can be any one of .
The solution to an inequality in two variables is an entire region!
Example
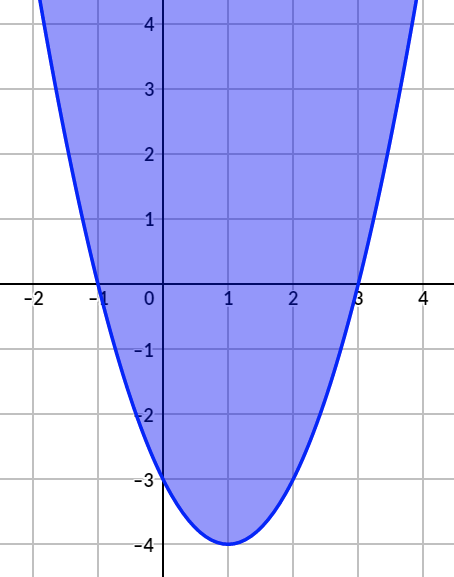
The solution region of is the shaded region above the parabola (since the inequality is "greater than"):
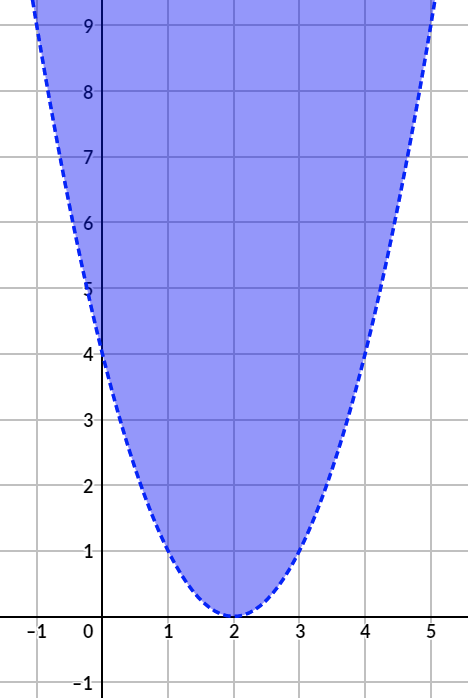
The boundary is a dashed parabola since the inequality is strictly greater than (not greater than or equal to).
Every point in the shaded region satisfies the inequality! (Not including the dashed boundary line.)
Check: Use a test point in the solution region and plug it into the inequality .
Let's try , so we sub in :
Since , the point satisfies the inequality.

0:00 / 0:00
Example: Solving Quadratic Inequalities in Two Variables
Consider the quadratic inequality .
a) Graph the solution region.
Start by graphing the boundary line (change the inequality into an equality):
Completing the square yields the vertex form:
We can plot the vertex at . The multiplied in front means we reflect the parabola vertically and stretch by a factor of 2.
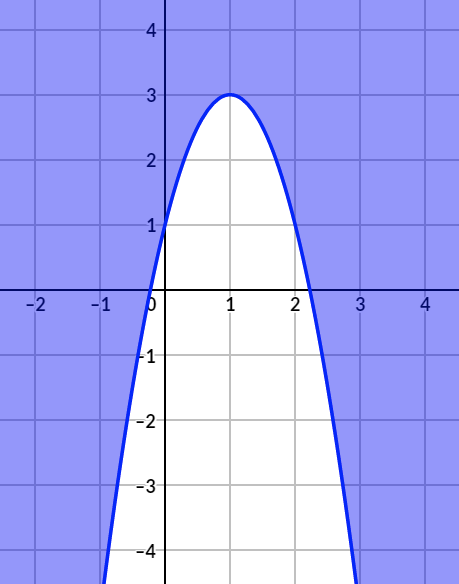
Note: Since the inequality is "greater than or equal to", the boundary line is solid. We shade the region above the boundary line.
b) Does the point satisfy the inequality?
Method 1: Graph
Looking at the graph, the point falls outside the solution region (unshaded), so it does NOT satisfy the inequality.
Method 2: Using the Inequality
Using and substituting the coordinates :
But , therefore the point does NOT satisfy the inequality.
Practice: Solving Quadratic Inequalities in Two Variables
Select all of the inequalities for which the point is a solution.
Practice: Solving Inequalities in Two Variables
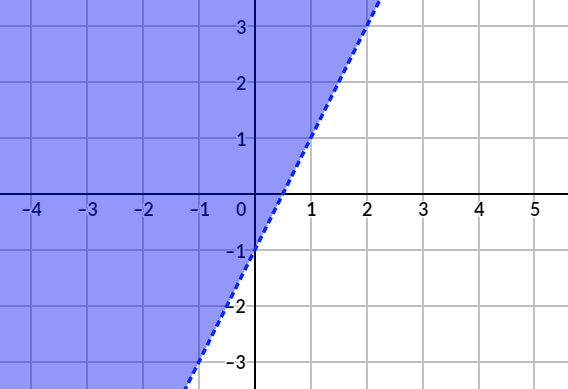
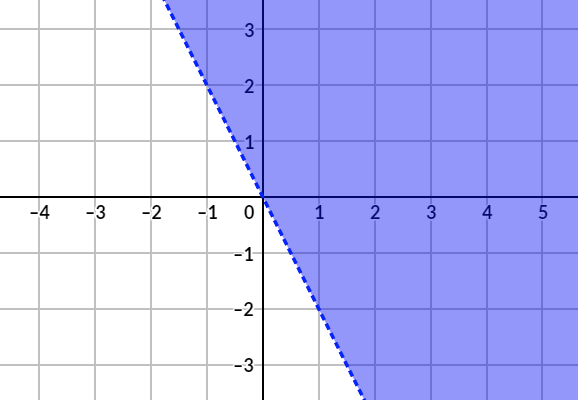
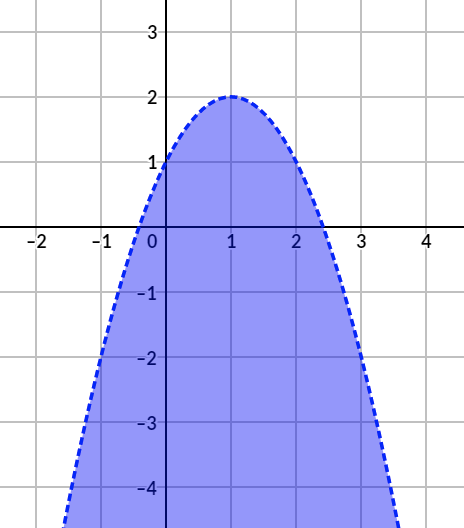
Match the graph of each solution region with the corresponding inequality.
Try graphing each inequality on your own!
A.
B.
C.
D.
E.