Wize High School Grade 12 Pre-Calculus Textbook > Trigonometric (Sinusoidal) Graphs
Transformations of Sinusoidal Functions
Popular Courses
Grade 12 Advanced Functions
Ontario High School
Grade 12 Pre-Calculus/Functions
Canada High School
Algebra II
US High School
Math 30-1
Alberta High School
Pre-Calculus 12
British Columbia High School
MATH 201
Concordia University
MATH 1149
Ohio State University
MAC 1140
University of Florida
MATH 150
Texas A&M University
MATH 41
Pennsylvania State University
MAC 1105
Florida State University
MAT 012
University of California - Davis
MTH 103A
Michigan State University
MTH 116
Michigan State University
MAC 1147
University of Florida
MATH 140
San Diego State University
MA 15800
Purdue University
MAC 1140C
University of Central Florida
MAC 1114C
University of Central Florida
MATH 102
California State University - Northridge
0:00 / 0:00
Transformations of Sinusoidal Functions (Pt 1)
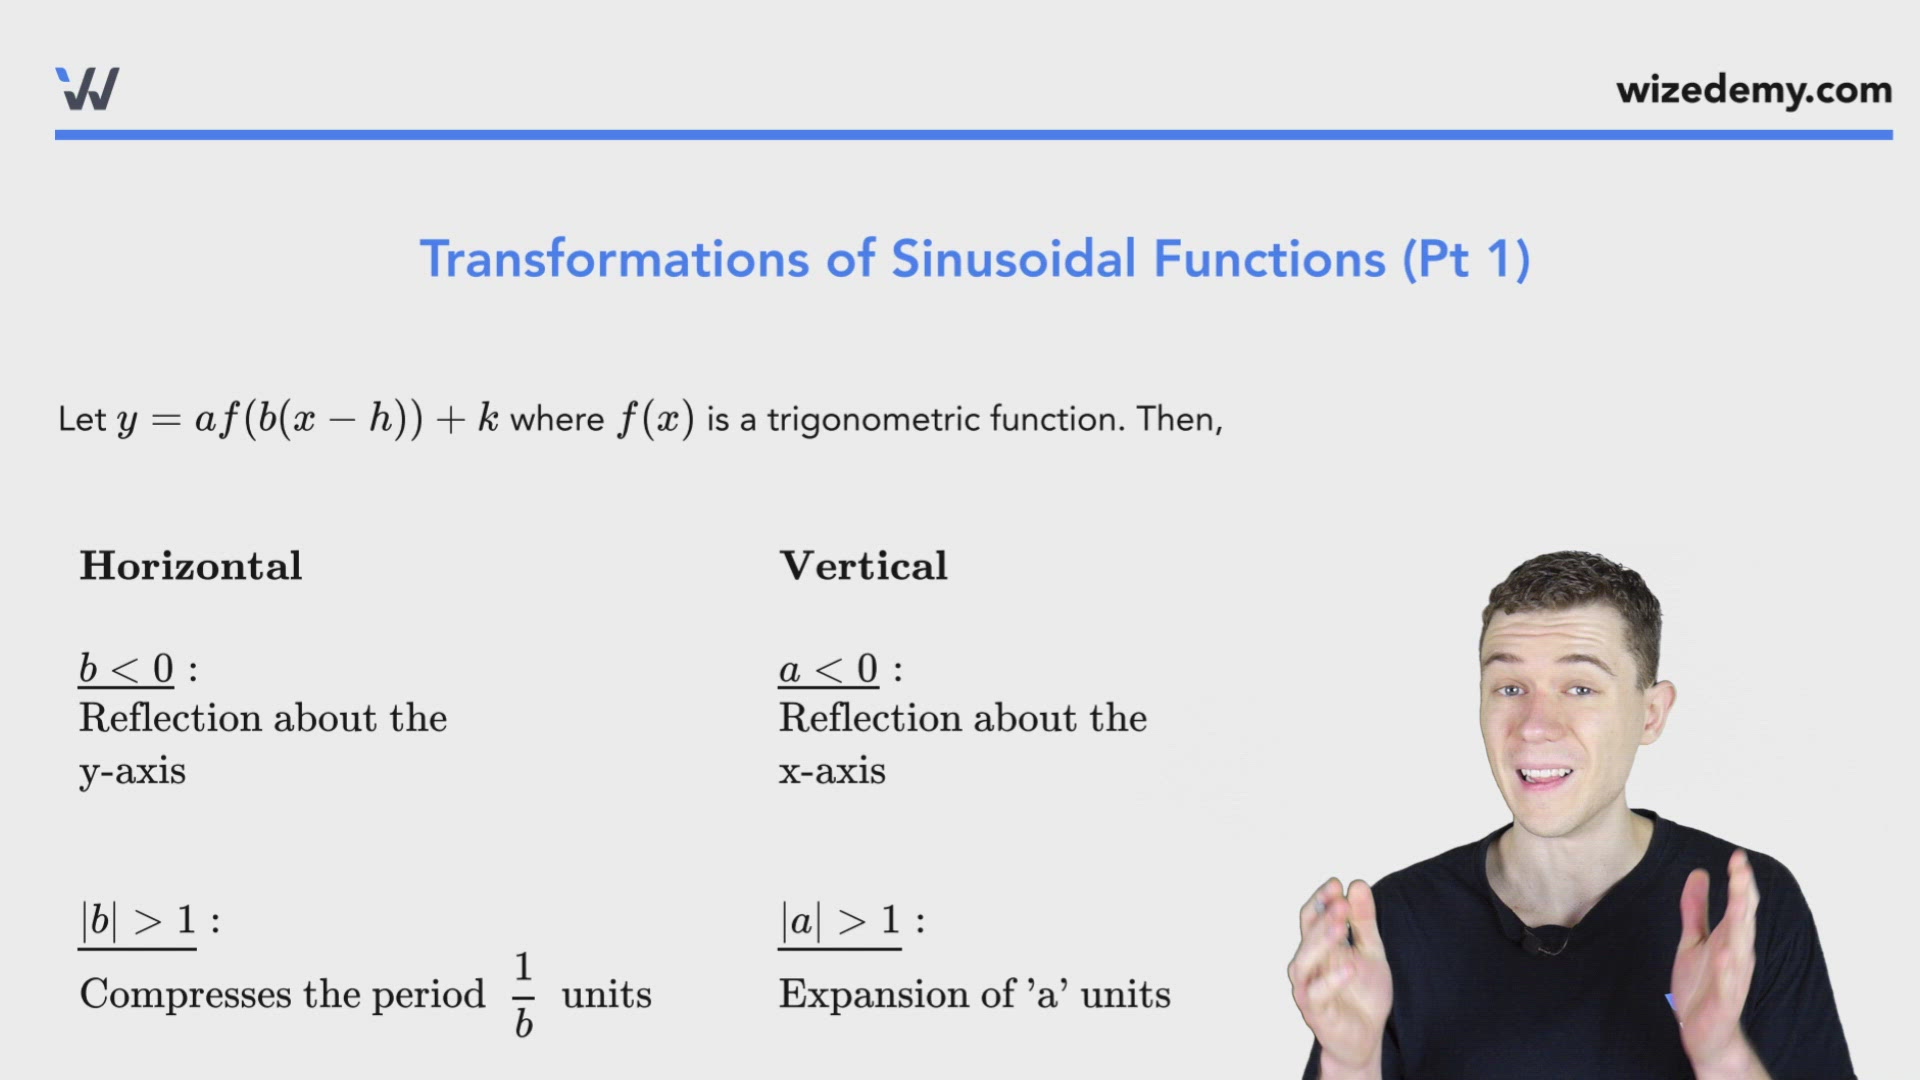
Let where is a trigonometric function. Then,
Wize Tip
The value is the period.
How to Graph the Transformation of a Sine or Cosine Function
Step 1.
Find the period.
Count 8 spaces from the origin (left and/or right).
Label the period.
Label the rest of the graph.
Step 2.
Find the amplitude '
Step 3.
Find the vertical displacement ''.
Step 4.
Identify:
Step 5.
Identify the phase shift and determine how many units to the left or right the function must move.
Step 6.
Graph.
If :
Begin on a .
Count 2 units right and plot a .
Count 2 units right and plot a .
Count 2 units right and plot a .
Count 2 units right and plot a .
Continue this pattern in the right/left direction.
If :
Begin on a .
Count 2 units right and plot a .
Count 2 units right and plot a .
Count 2 units right and plot a .
Count 2 units right and plot a .
Continue this pattern in the right/left direction.
Example 1
Let's look at .
Step 1.
Find the period.
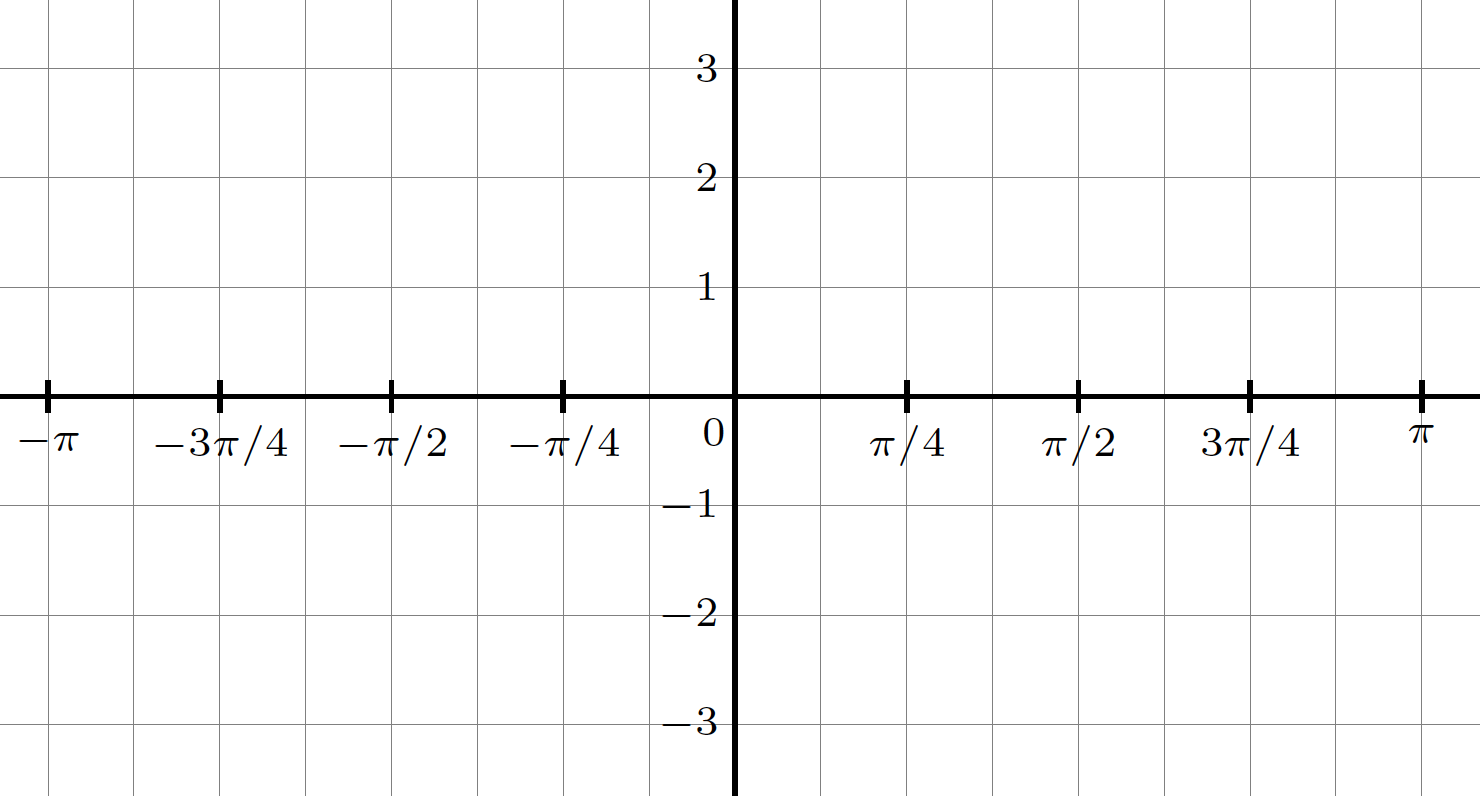
Count 8 spaces from the origin (left & right).
Label the period.
Label the rest of the graph.
Step 2.
Find the amplitude.
Step 3.
Find the vertical displacement.
Step 4.
Identify the .
Step 5.
Identify the phase shift and determine how many units to the left or right the function must move.
The phase shift is units right.
So, how many cartesian coordinates right is this?
This means that is 2 units right from the origin.
Step 6.
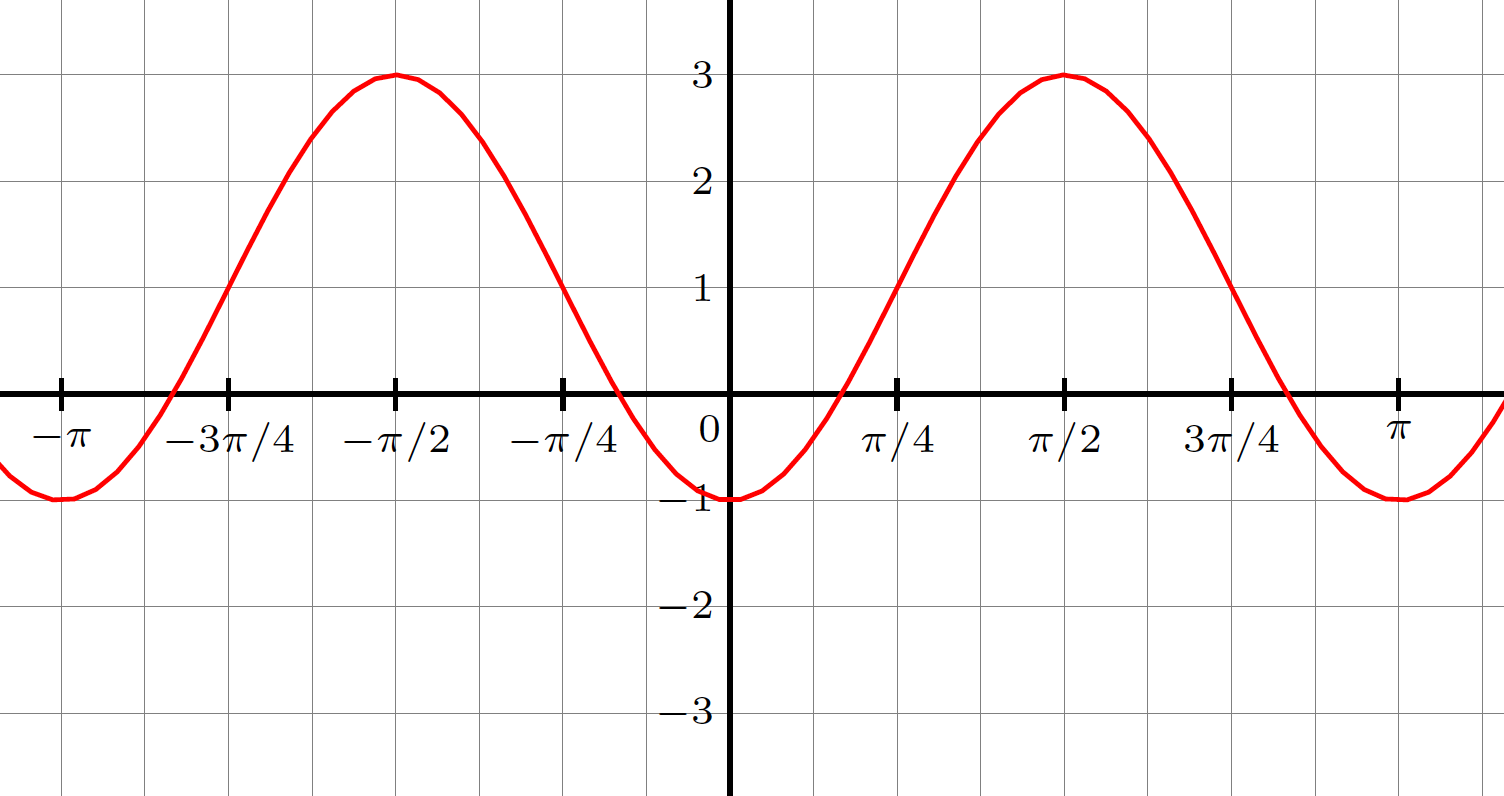
Since we are graphing , then we begin on an of
Count 2 spaces to the right and plot the at
Count 2 spaces to the right and plot the of
Count 2 spaces to the right and plot the of
Count 2 spaces to the right and plot the of
Continue on with this pattern in both directions,
0:00 / 0:00
Example: Transformations of Sinusoidal Functions
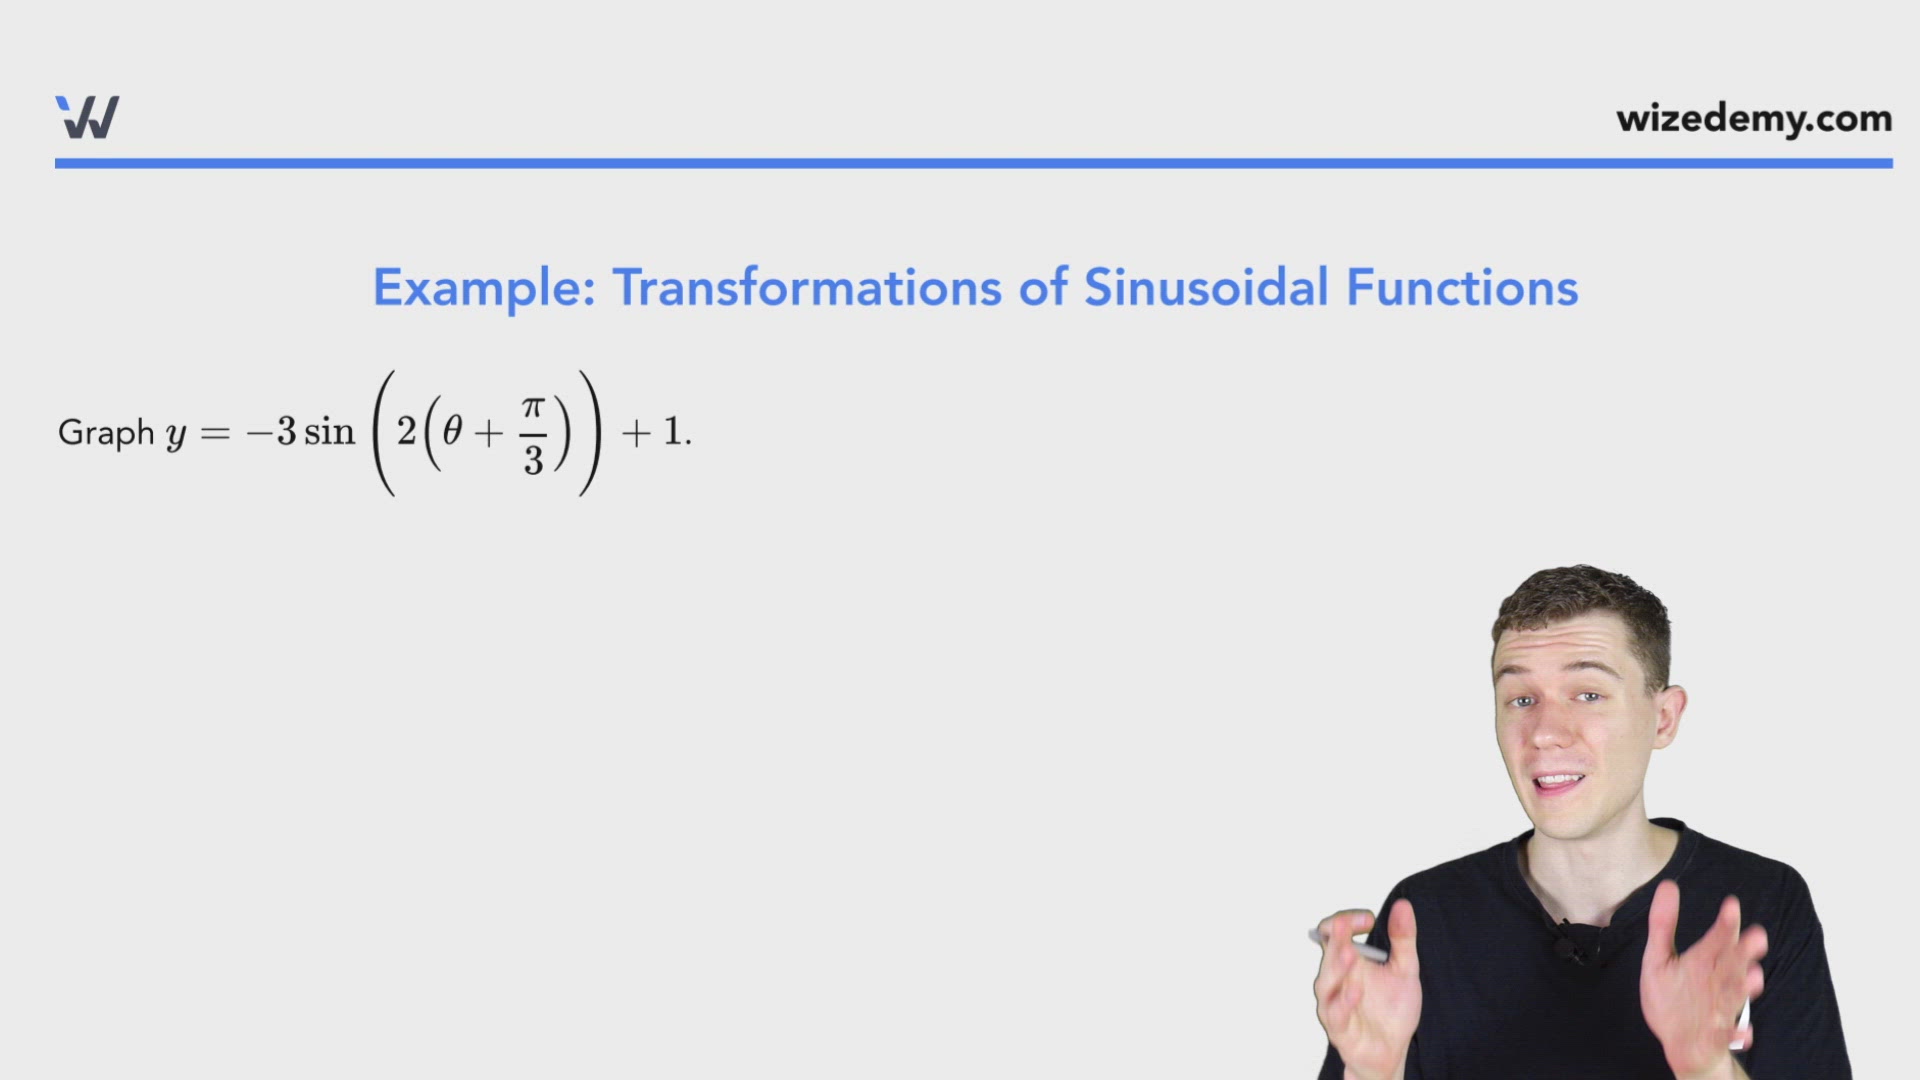
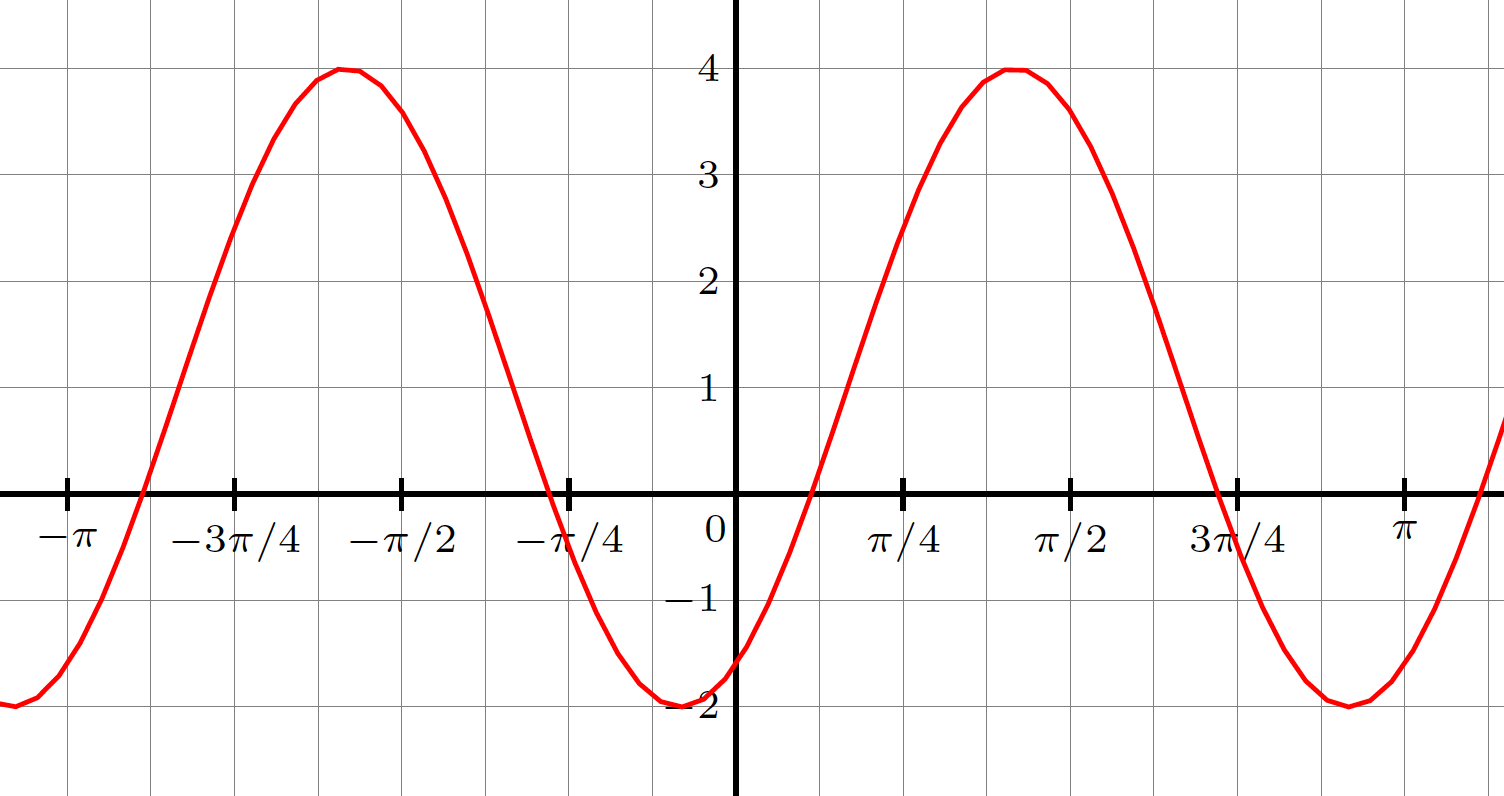
Graph .
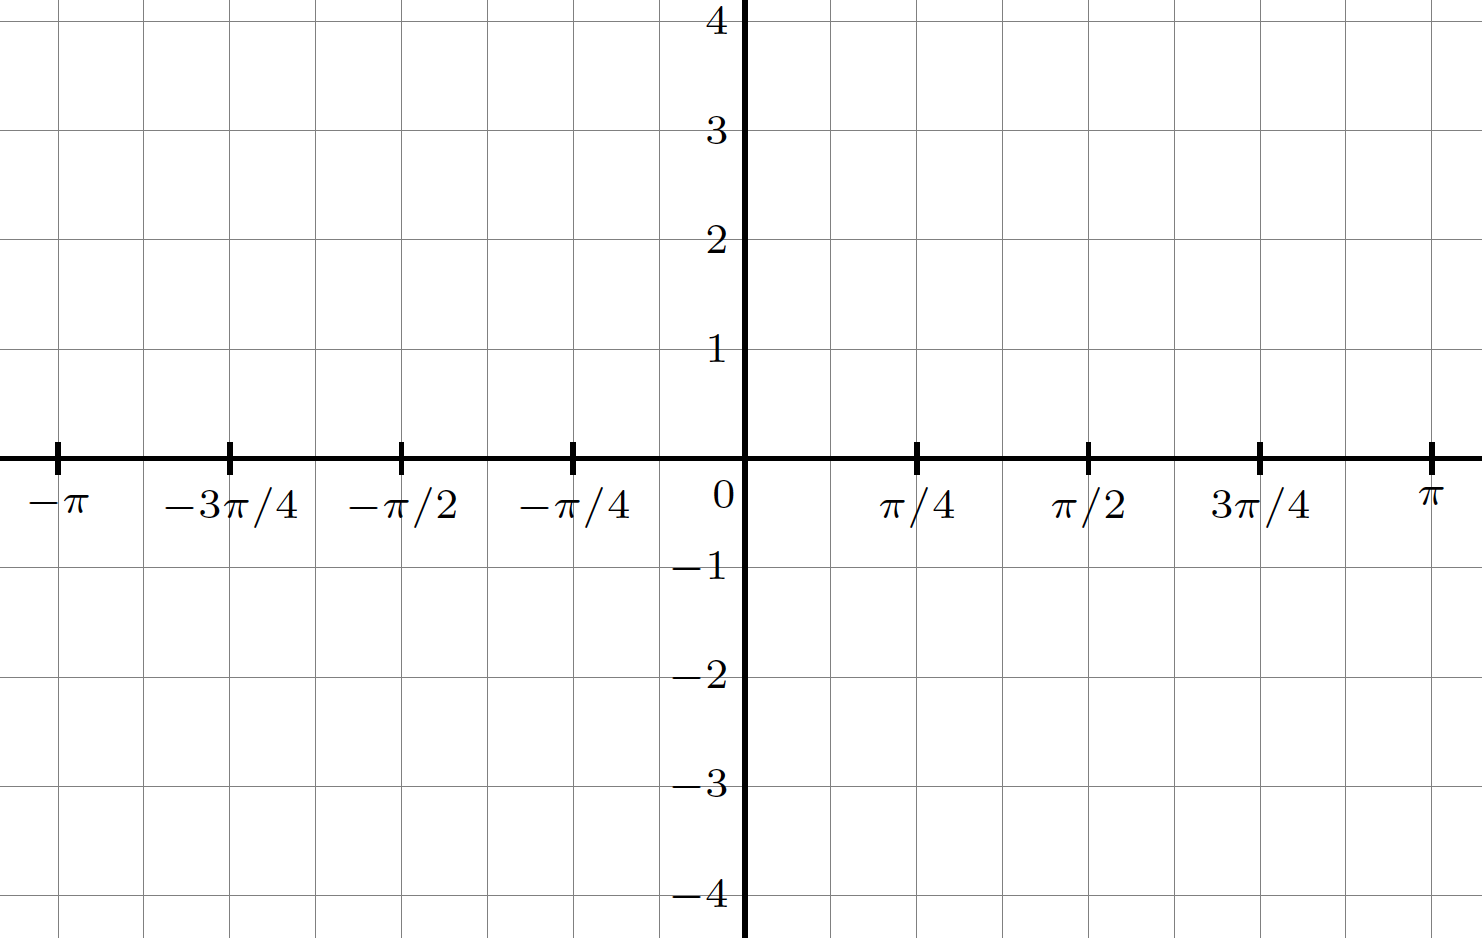
Step 1.
Find the period.
Count 8 spaces from the origin (left & right).
Label the period.
Label the rest of the graph.
Step 2.
Find the amplitude.
Step 3.
Find the vertical displacement.
Step 4.
Identify the .
Step 5.
Identify the phase shift and determine how many units to the left or right the function must move.
The phase shift is units left.
Therefore,
This means that is units left of the origin.
Step 6.
Since we are graphing , then we begin on an of
Count 2 spaces to the right and plot the at
Count 2 spaces to the right and plot the of
Count 2 spaces to the right and plot the of
Count 2 spaces to the right and plot the of
Continue on with this pattern in both directions.
0:00 / 0:00
Transformations of Sinusoidal Functions (Pt 2)
How to Graph the Transformation of a Tangent Function
Step 1.
Find the period.
Count 4 spaces from the origin (left & right).
Label the period.
Label the rest of the graph.
Step 2.
Identify the phase shift and calculate how many units left/right the shift is.
Step 3.
Identify the x-intercepts.
Step 4.
Identify the vertical asymptotes.
Step 5.
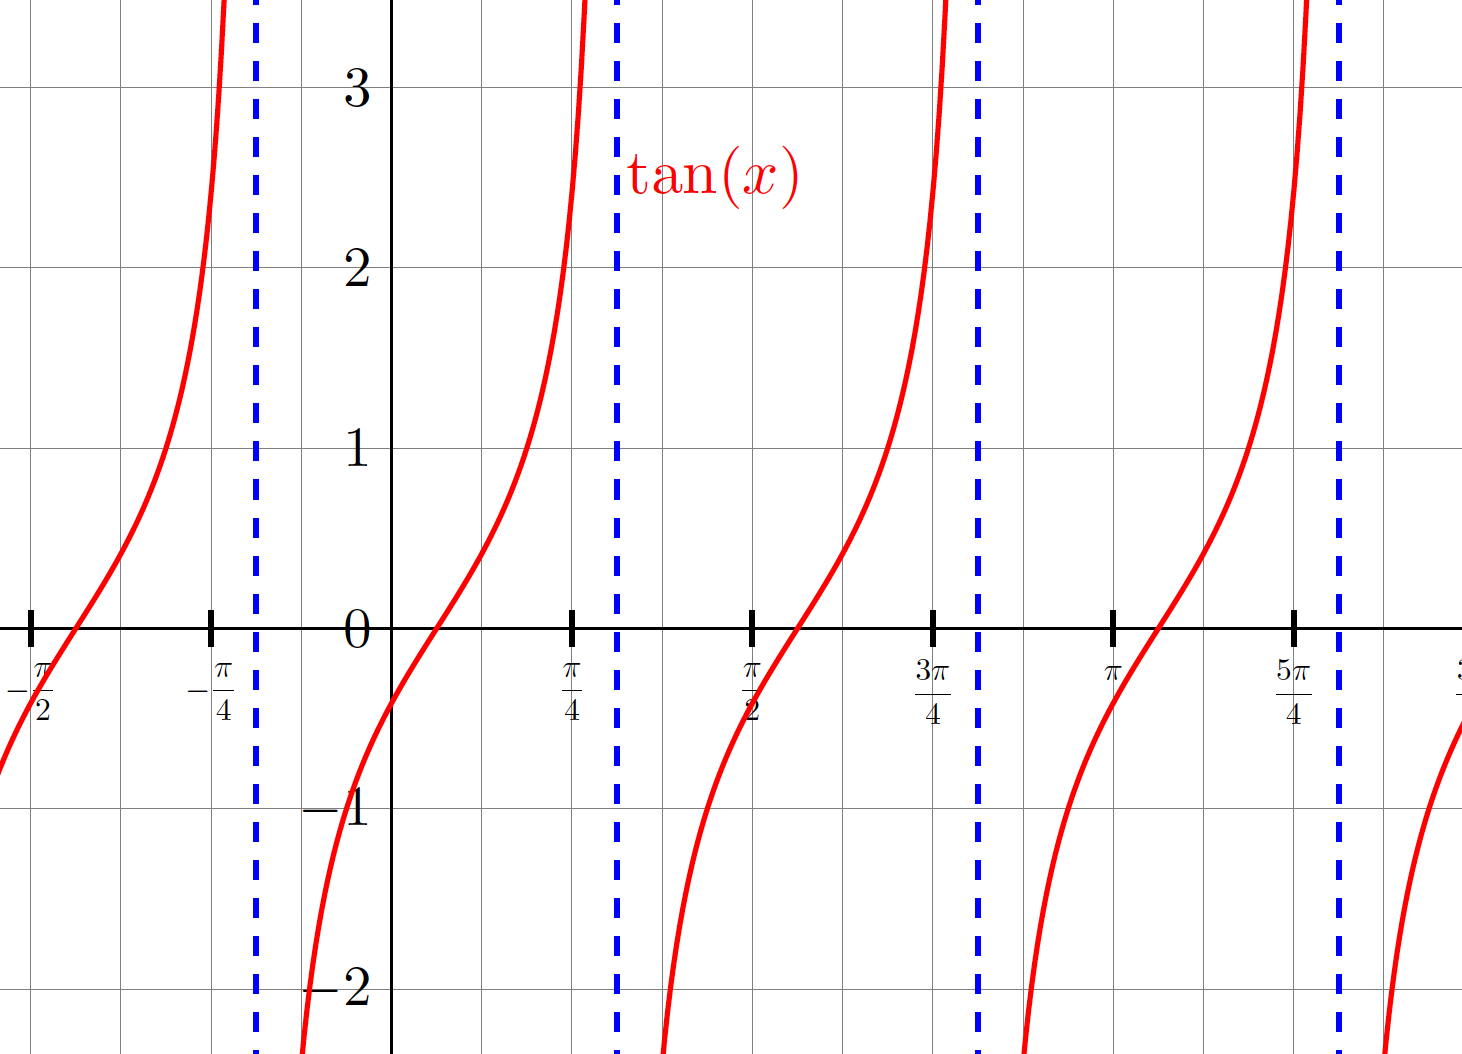
The points are on the graph of .
Find the points on the transformed function.
Step 6.
Graph.
Begin with an
Count 2 units right and draw a
Count 2 units right and draw an
Count 2 units right and draw a
Count 2 units right and draw an
Continue this pattern right/left.
Example
Let's look at .
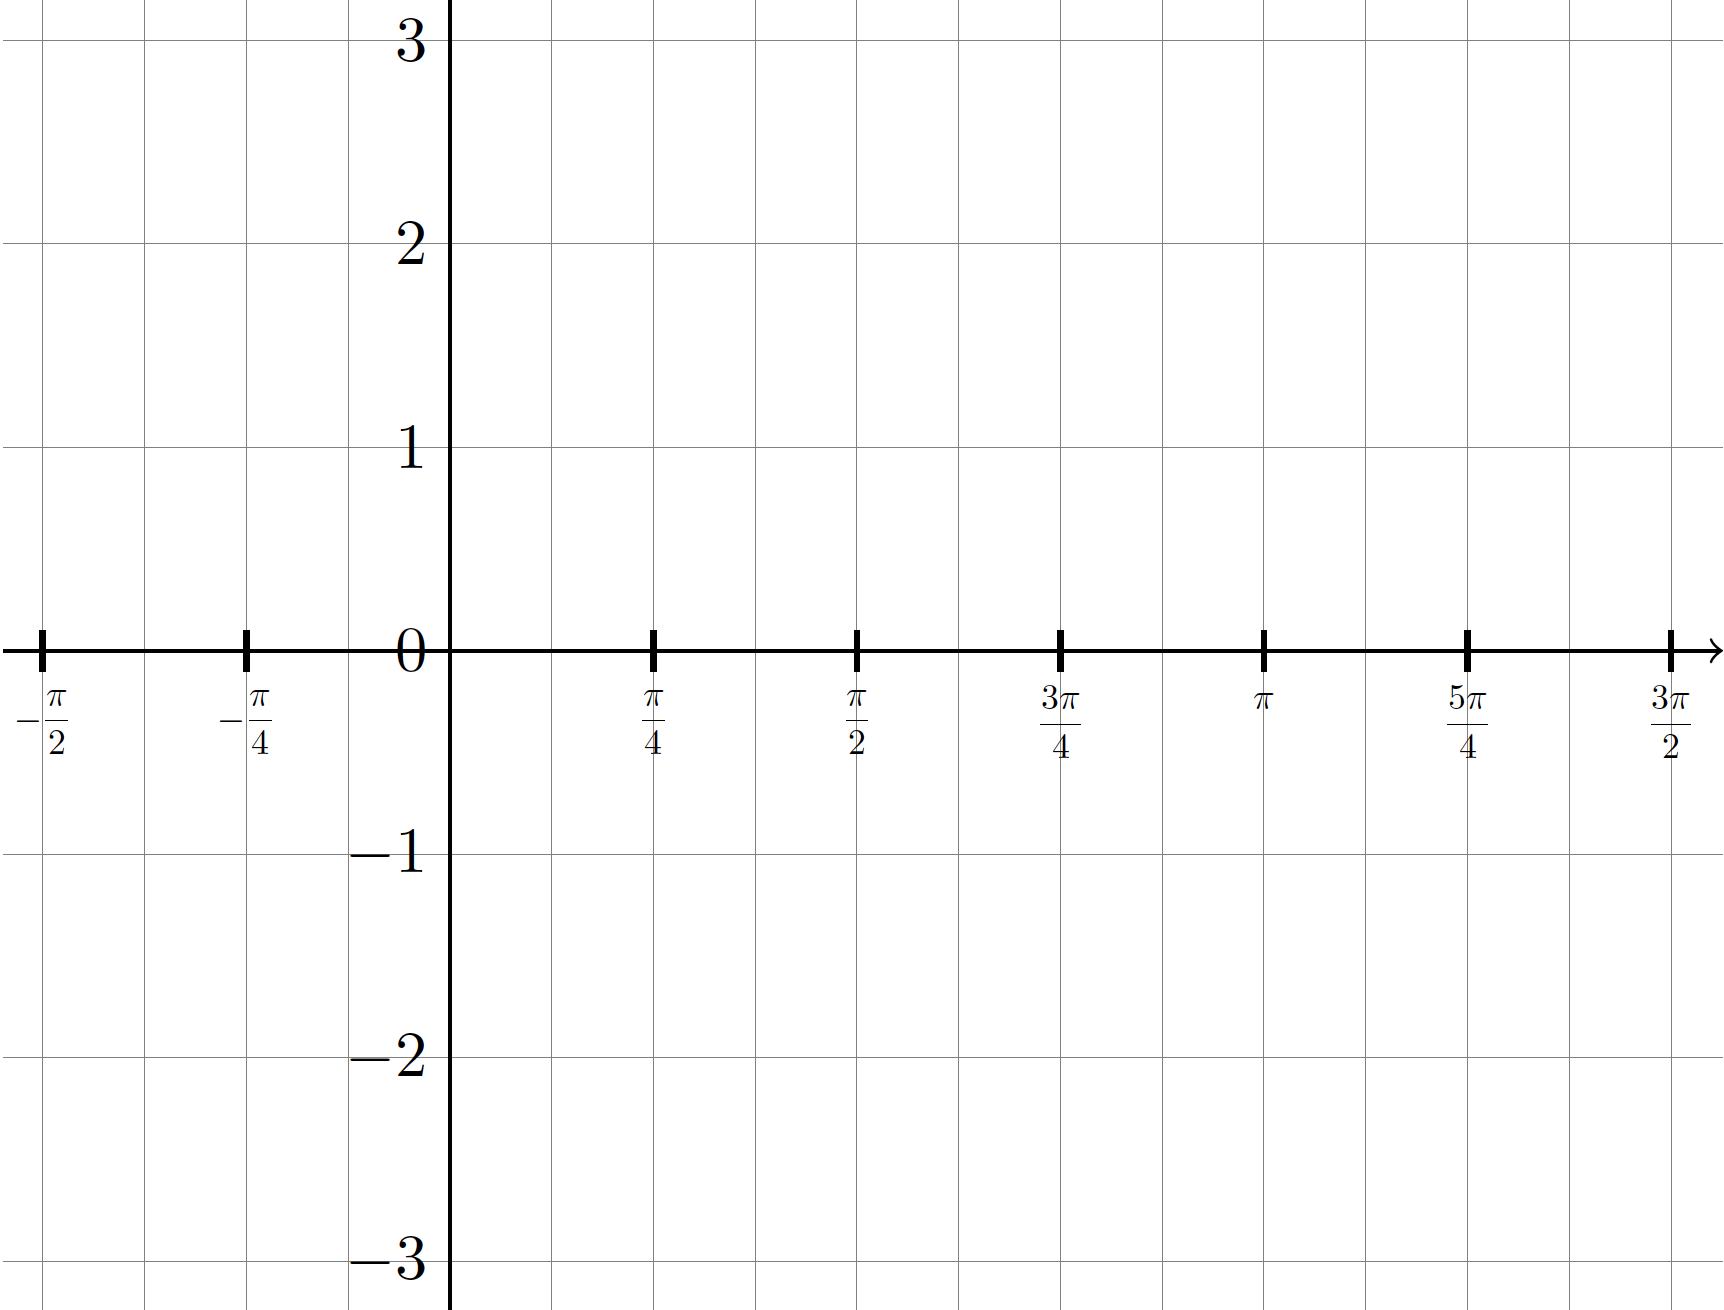
Step 1.
Count 4 spaces from the origin (left & right).
Label the period.
Label the rest of the graph.
Step 2.
Therefore, is 0.5 units right.
Step 3.
X-intercepts:
Step 4.
Vertical asymptotes:
Step 5.
Step 6.
Graph.
Begin with an at
Count 2 units right and draw a at
Count 2 units right and draw an at
Count 2 units right and draw a at
Count 2 units right and draw an
Count 2 units right and draw a at
Continue this pattern right/left.
Plot the points from Step 5 and connect the dots, trending towards the asymptotes.
0:00 / 0:00
Example: Transformations of Sinusoidal Functions
Graph .
Step 1.
Count 4 spaces from the origin (left & right).
Label the period.
Label the rest of the graph.
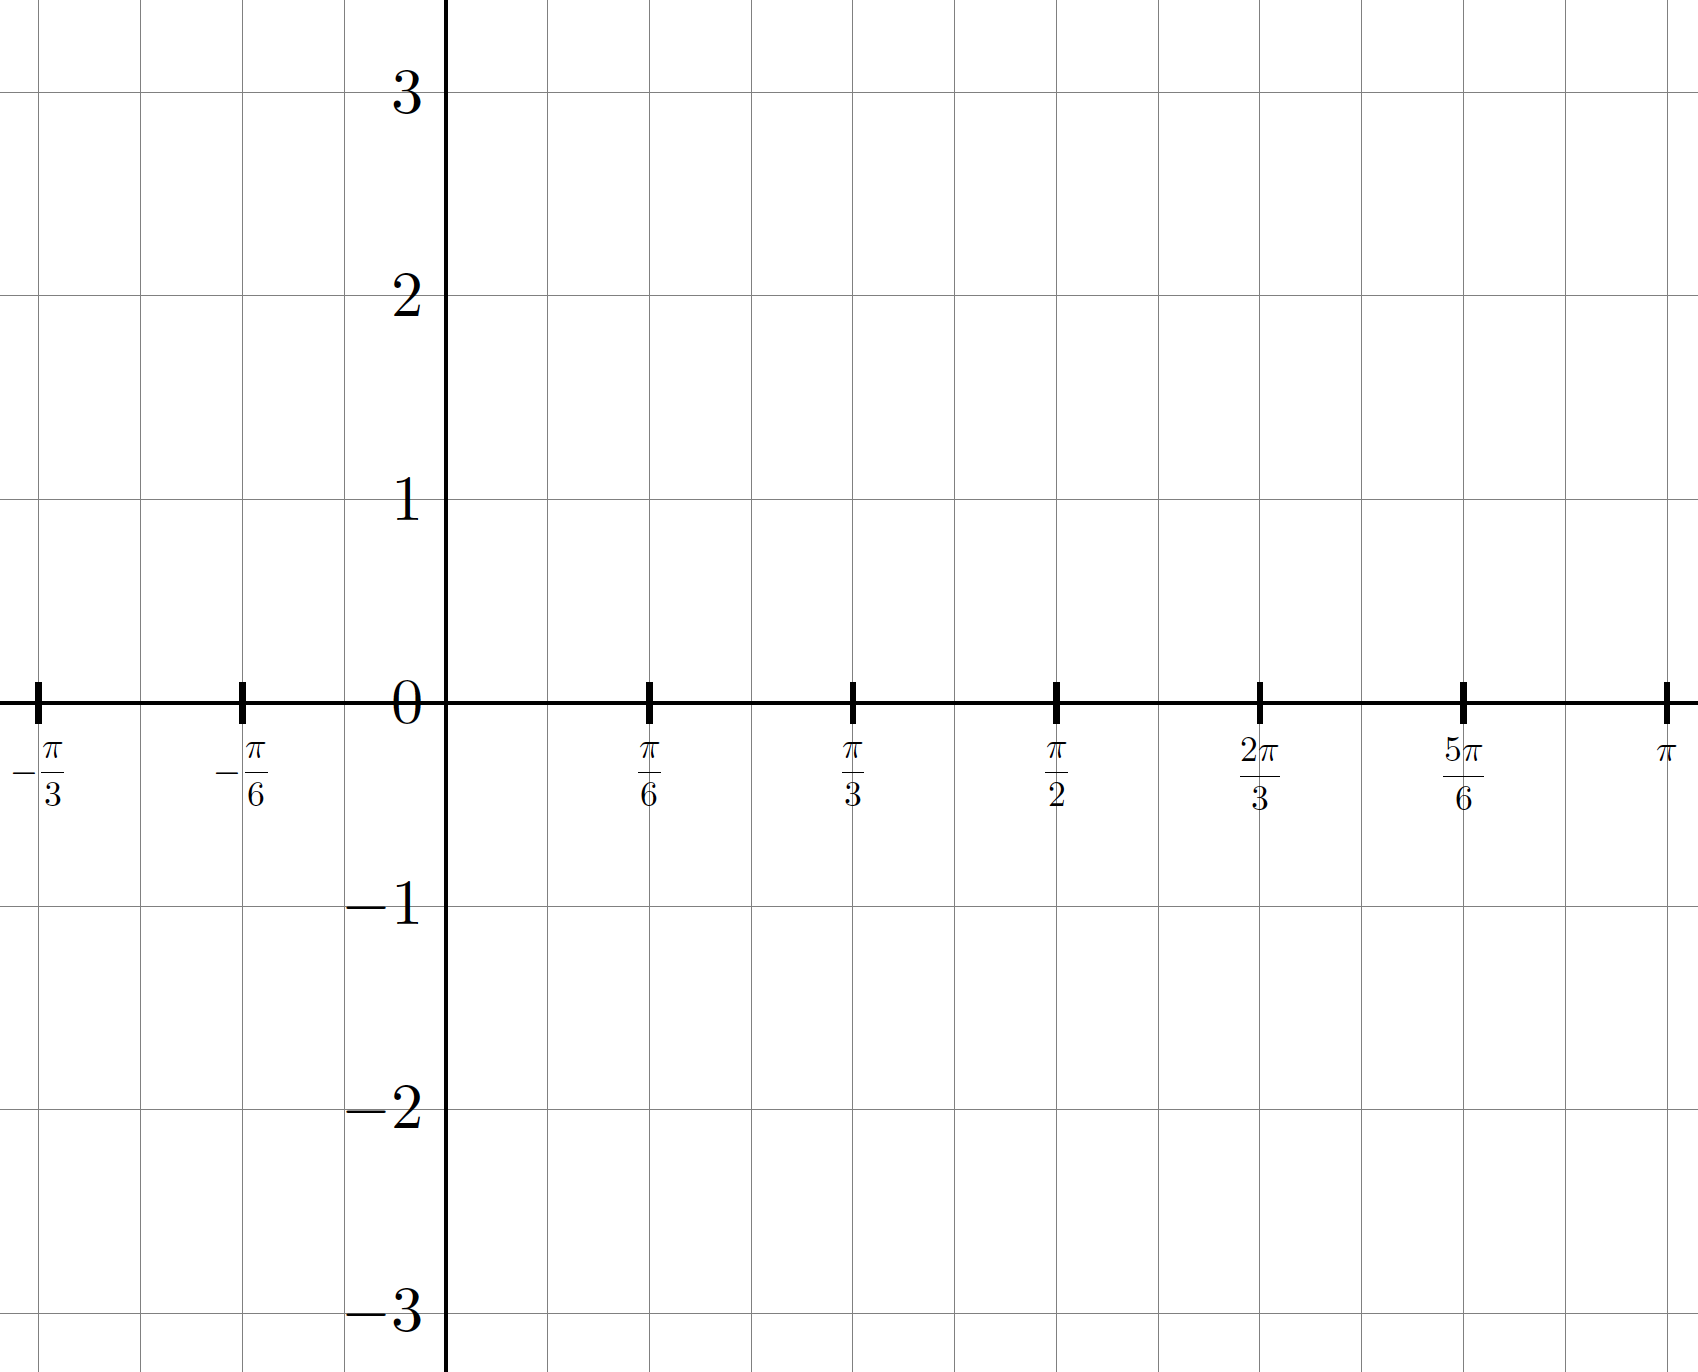
Step 2.
unit to the right.
Step 3.
Step 4.
Step 5.
Step 6.
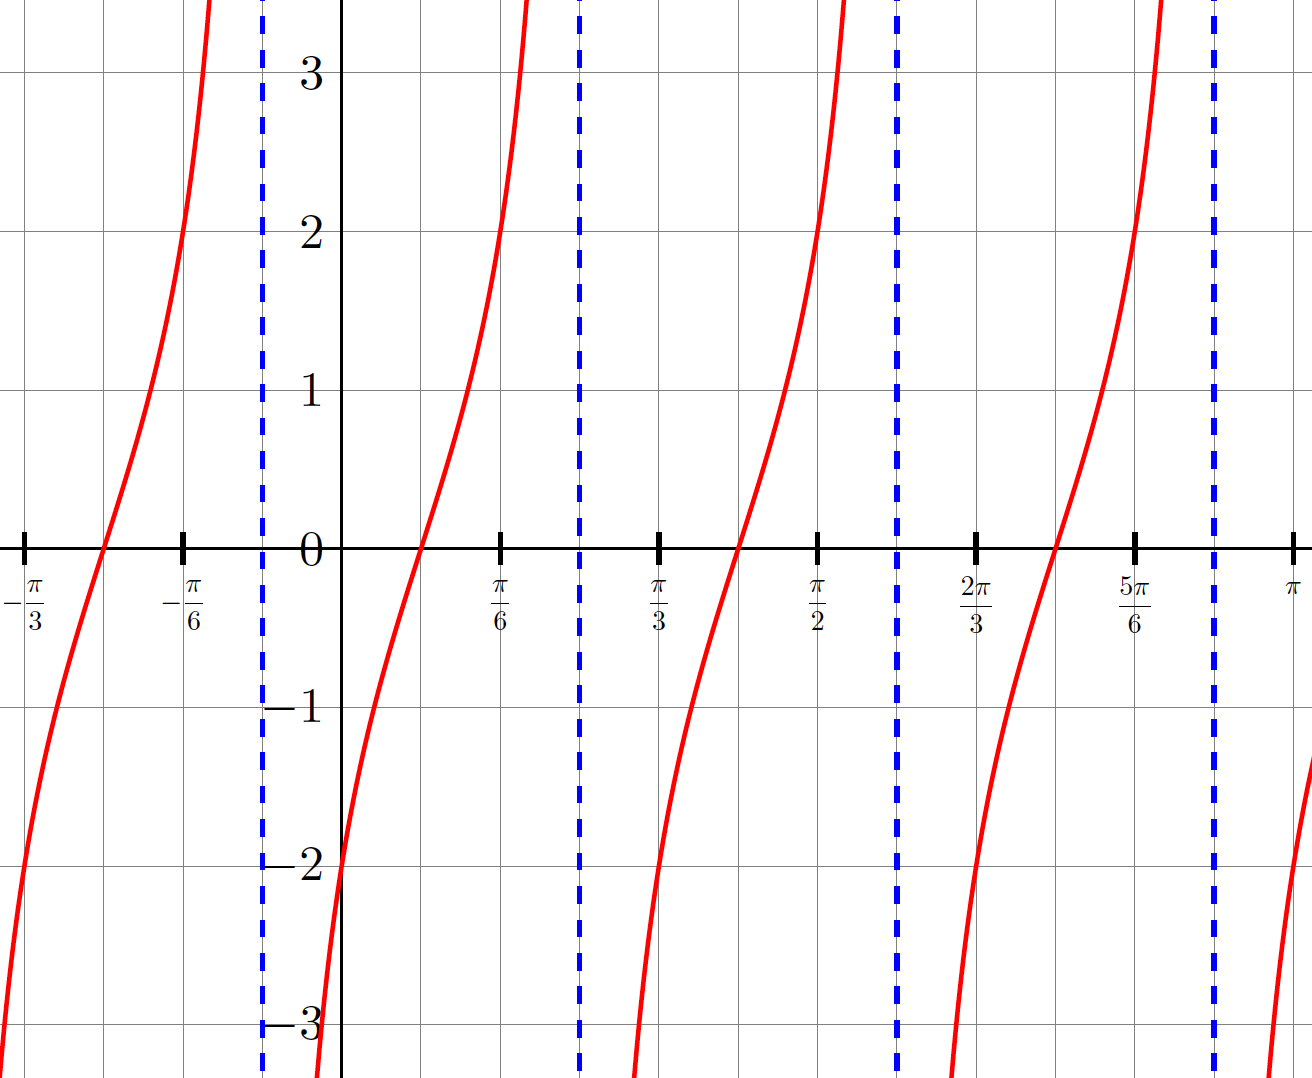
Graph.
Begin with an at
Count 2 units right and draw a at
Count 2 units right and draw an at
Count 2 units right and draw a at
Count 2 units right and draw an
Count 2 units right and draw a at
Continue this pattern right/left.
Plot the points from Step 5 and connect the dots, trending towards the asymptotes.
Practice: Transformations of Sinusoidal Functions
The following is a table of values describing a sinusoidal relationship between and
What function best describes the tables of values?
Practice: Transformations of Sinusoidal Functions
Let undergo the following transformations:
- A vertical compression by a factor of
- A horizontal compression by a factor of
- A phase shift/horizontal translation of units left
Which of the following graphs best displays the graph of the transformed function?
Practice: Transformations of Sinusoidal Functions
If is on the function , what point must be on the function ?