Wize High School Grade 9 Math Textbook > Investigating Relationships
Plotting & Interpreting Data

0:00 / 0:00
Plotting & Interpreting Data
Numerical Data
Numerical data is information or facts about a variable. There are two main types of numerical data:
- Continuous data -- you measure these
- Discrete data -- you count these

When we don't know if two variables are related, we can perform an experiment to collect numerical data about the variables in order to see if there's a relationship between the variables.
Experiment Example 1
An experiment can be in the form of a survey asking home owners the number of rooms in their house and their house prices.
- One variable isthe number of rooms, which is adiscretenumerical data
- Another variable isthe house price, which is adiscrete/continuousnumerical data
Example 2
An experiment can be in the form of dropping an egg from different floors of a building and recording the time it takes the egg to reach the ground
- One variable isthe height in which the egg is dropped, which is acontinuousnumerical data
- Another variable isthe time it takes the egg to reach the ground, which is acontinuousnumerical data
Example 3
An experiement can be in the form of gathering information on the age a patient when they are first diagnosed with lung cancer and the patient's life expectancy
- One variable isthe age of the pateint, which is acontinuous/discretenumerical data
- Another variable isthe patient's life expectancy, which is acontinuous/discretenumerical data
How to organize numerical data
It is common to organize the numerical data gathered from an experiment using a table of values.
Then we can plot this data on a scatter plot:
- Identify the indpendent (horizontal axis) and dependent (vertical axis) variable in the experiment
- Plot the points from the table of values on the graph
- Observe whether there's a relationship between the variables
Wize Tip
Sometimes we can connect the data points to see if there's a trend/relationship between the variables.
- If the data is continuous, we connect the points using a solid line (all values in between points are possible)
- If the data is discrete, we connect the points using a dotted line (it's not possible for the variable to take on values in between points)
0:00 / 0:00
Example: Plotting & Interpretting Data
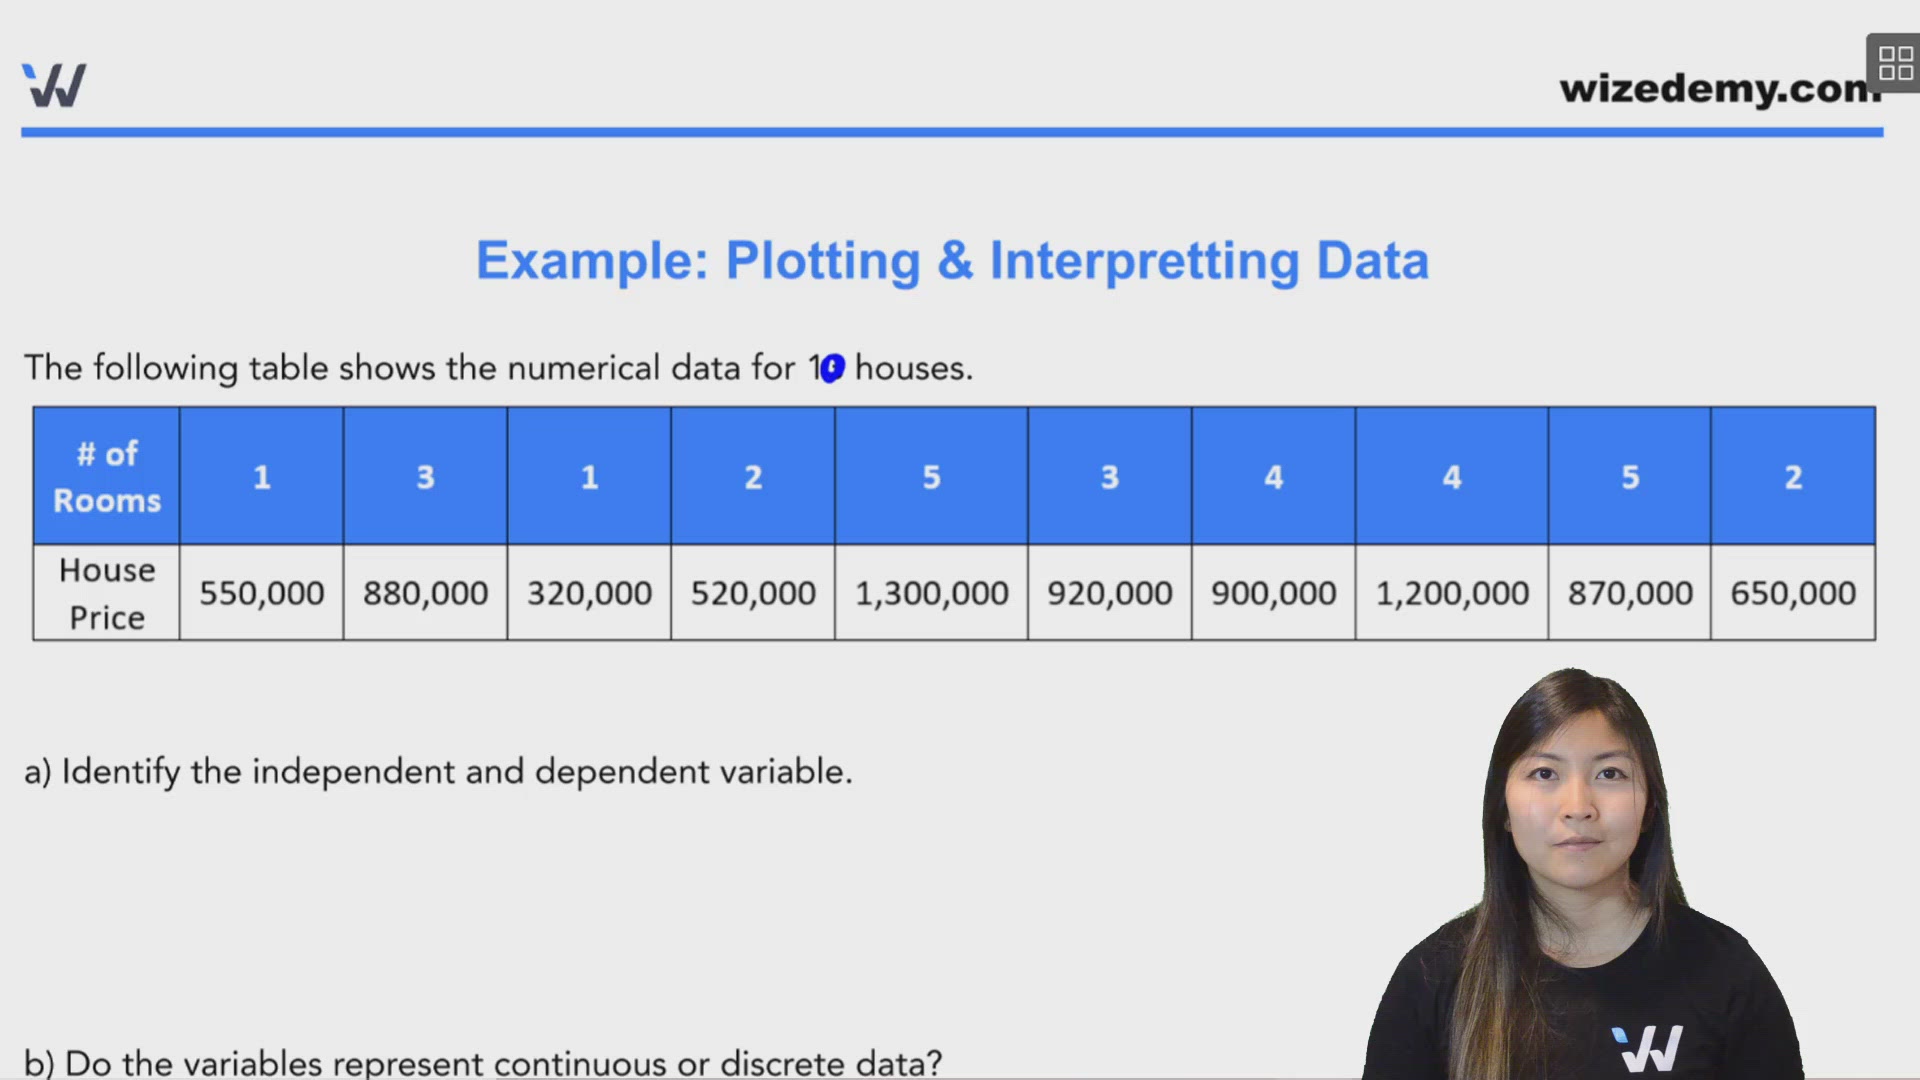
The following table shows the numerical data for 10 houses.

a) Identify the independent and dependent variable.
Since the house price will typically depend on the number of rooms, the independent variable is the # of rooms, and the dependent variable is the house price.
b) Do the variables represent continuous or discrete data?
- We can count the # of rooms -- it is discrete
- House prices are represent in large dollar amounts -- it is continuous (technically money can be discrete since we can count money and the increase is in step amounts, but since the dollar values are really large in this example, we can consider house prices as continuous data)
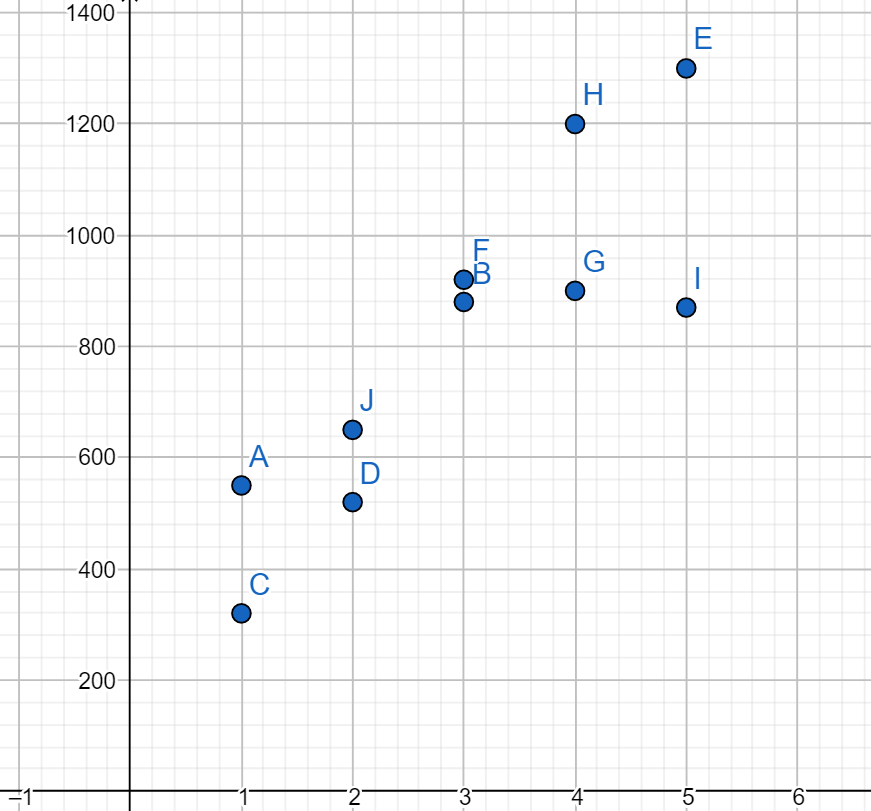
c) Construct a scatter plot for the data.
The horizontal axis represents the number of rooms. The vertical axis represents the house price in thousands of dollars.
d) Does the scatter plot suggest that the # of rooms in a house is related to the house price?
Since the points seem to be going up and to the right, it suggests that the number of rooms and house prices are related -- the more rooms there are, the more expensive the house price seems to be.
Practice: Interpretting Data
The following graph represents the temperature (in ) at different months of the year (from January to June).
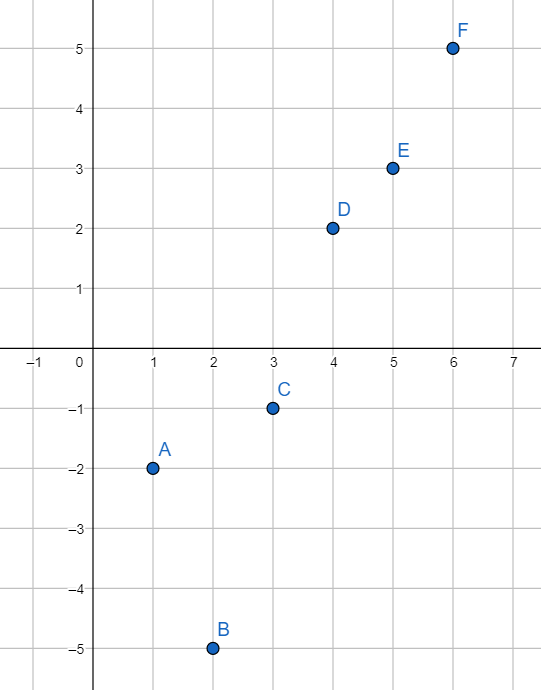
Which is the independent variable and the dependent variable?
Practice: Plotting Data
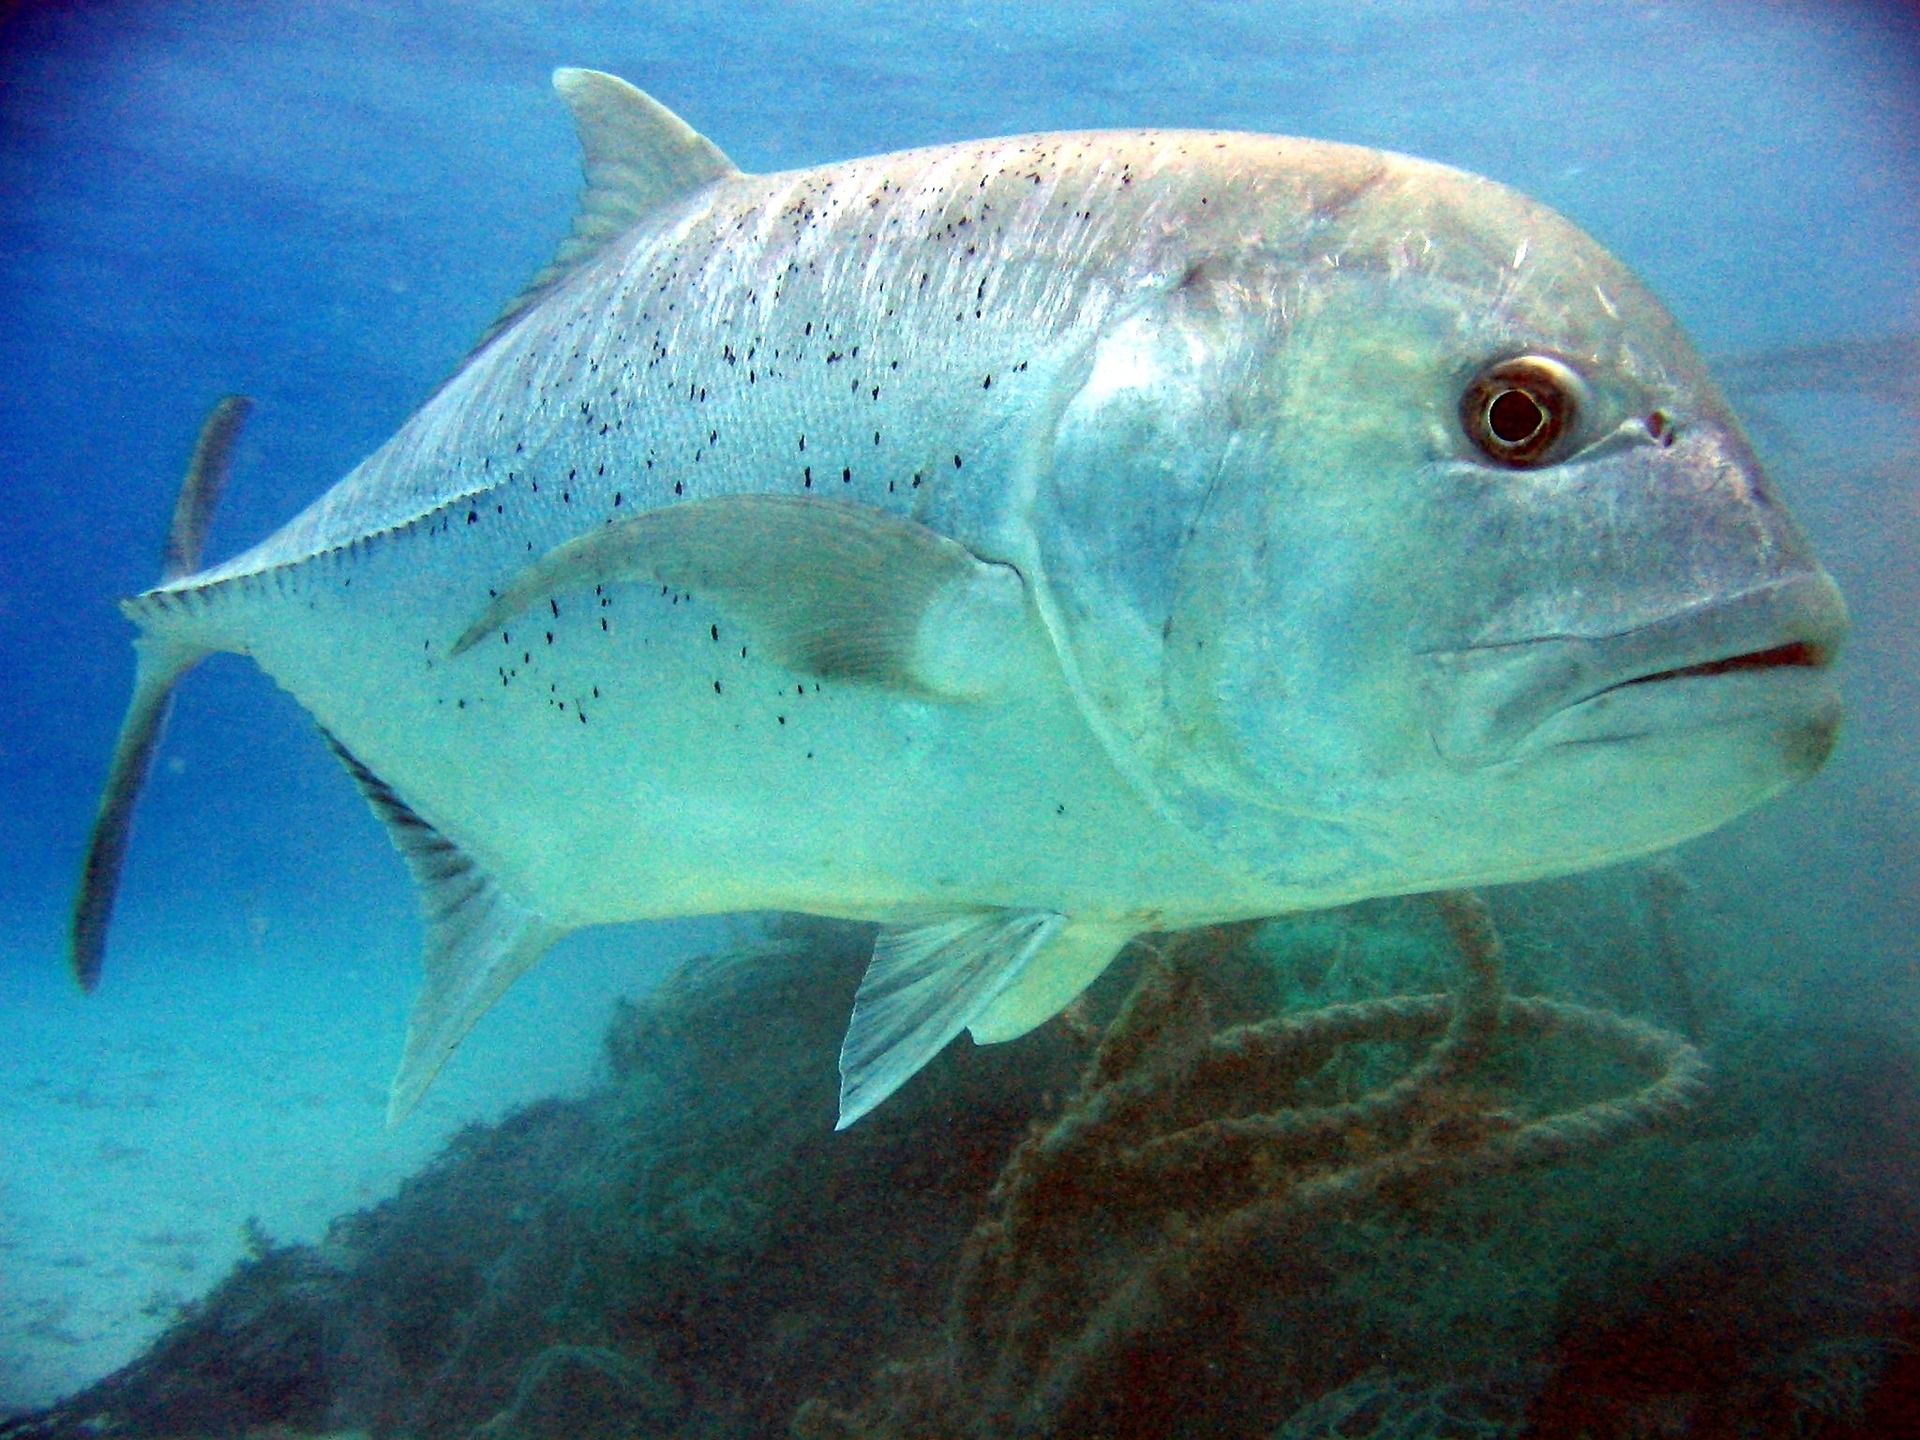
There's a species of fish called the Giant Trevally that can jump out of water to catch and eat birds that are flying just above the water. The following table shows the height of one of these fish.

a) Is time the independent or dependent variable in this situation?
b) Is height the independent or dependent variable in this situation?
c) Create a scatter plot for this data.
Practice: Plotting & Interpretting Data
The number of rabbits in a certain forest is given by the following table of values

a) Identify the independent and dependent variable.
b) Create a scatter plot for this data.
c) Does there appear to be a relationship between the variables.
d) Describe this relationship if there is one.