Popular Courses
MCAT
General Course
General Chemistry
University Study Guides
CHEM 1A03
McMaster University
CHEM 1A03
McMaster University
CHEM 101
University of Alberta
CHEM 112
Queen's University
DAT
General Course
Chemistry
General Course
CHEM 1AA3
McMaster University
CHEM 103
University of Alberta
General Chemistry
University Study Guides
CHM135H1
University of Toronto
CHEM 154
University of British Columbia
CHEM 101
University of Victoria
CHEM 120
University of Waterloo
CHY 102
Toronto Metropolitan University
CHEM 121
Simon Fraser University
CHEM 120
McGill University
SC/CHEM 1000 3.00
York University
CHE 102
University of Waterloo

0:00 / 0:00
Phase Diagram
A phase diagram is a plot of pressure vs temperature which describes the thermodynamically favored phase(s) for a substance.
The phase diagram below is one for compounds that have a higher density in their solid form than in their liquid form!
This describes most compounds in nature. A commonly seen example is CO2.

Triple Point: where solid, liquid and gas are at equilibrium
Critical Point: The point on a phase diagram at which the substance is indistinguishable between liquid and gaseous states
Supercritical Fluid: Matter which has been pushed to temperatures and pressures beyond those of its critical point.
- Label this in the diagram!
- This results in a fluid that displays properties of both a liquid and a gas (low viscosity of a gas, but high density of a liquid).
- No amount of pressure can force the substance back into the liquid phase
General Notes
Solids are favored at
high
pressures and low
temperaturesGases are favoured at
low
pressures and high
temperatures The normal boiling and melting points can be identified by drawing a horizontal line across P = 1 atm and observing where that line intersects the melting and vaporization curves.
How Phase Diagrams Relate to Density and Enthalpy

The phase diagram above is very similar to the one we just looked at for CO2 where the solid phase has a higher density than the liquid phase.

Based on the density relationships shown above we can say that:
Left: When a melting curve has a positive slope (most compounds) the solid is denser than the liquid.
Right: When a melting curve has a negative slope (more uncommon) the liquid is denser than the solid.
Water's melting curve has a negative slope in the phase diagram that we will look at next!
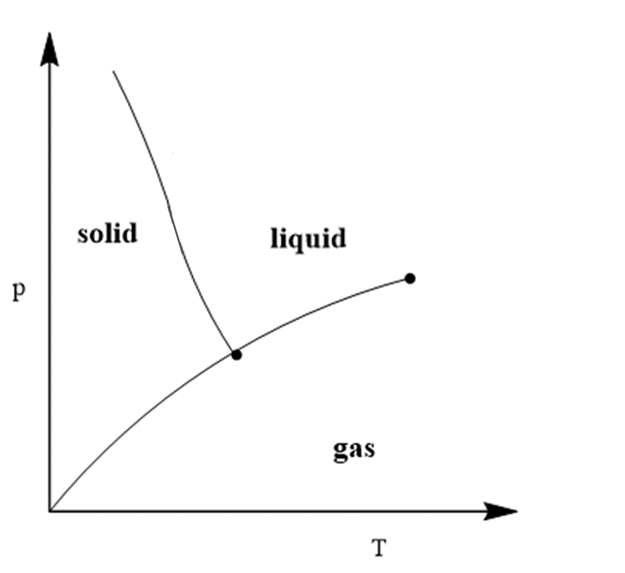
Water's Phase Diagram

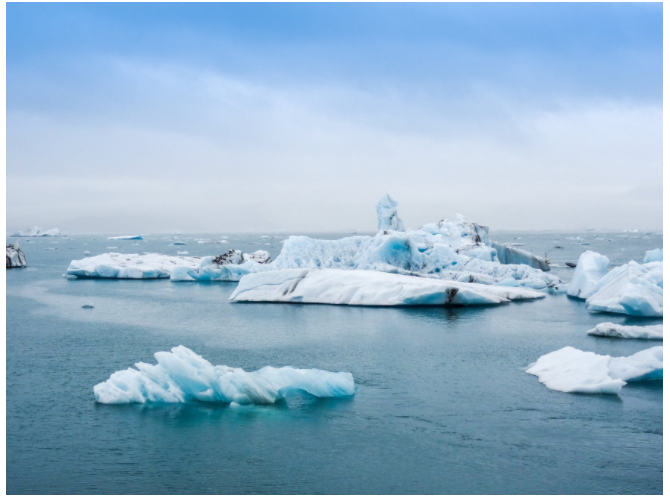
Phase diagrams that have negative slopes for the melting curve are for compounds that have a higher density in their liquid form than in their solid form!
We can remember this because we know that ice floats on water!
Wize Concept
Know that water's phase diagram has a negative slope for the melting curve, whereas most other compounds' phase diagrams have a positive slope.
0:00 / 0:00
Extra Low Yield Information for Phase Diagrams
How the Freezing Point of Water Changes With Increasing Pressure

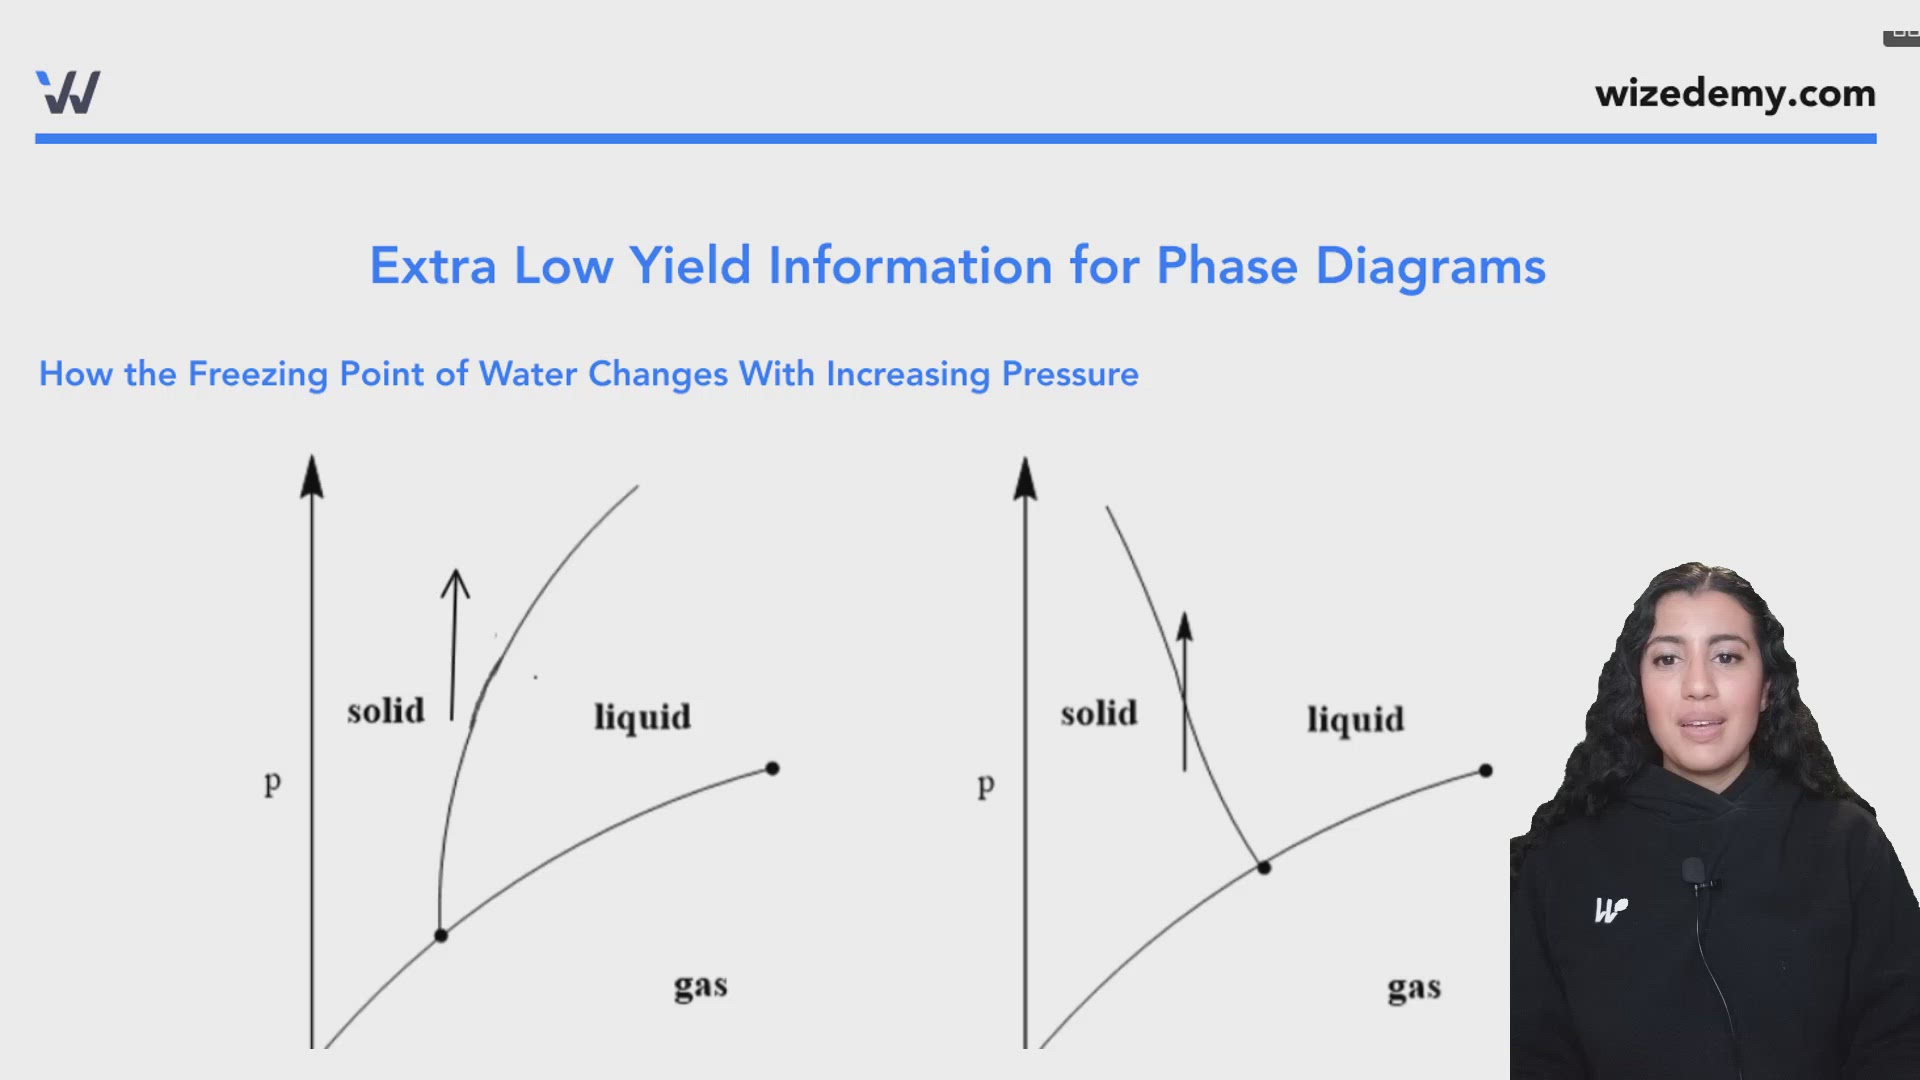
Above we have a phase diagram with a positive slope, and one with a negative slope. If we chose a point in the solid phase and increased the pressure (leaving temperature constant), what would happen?
- For the phase diagram with a positive slope, the substance would be in thesolidphase
- For the phase diagram with a negative slope (like water), the substance may now be in theliquidphase
What should happen to the freezing point in water's phase diagram when we increase pressure? Should it increase, decrease, or stay the same?
Decrease because of the negative slope line, the freezing point of water goes down as pressure increases
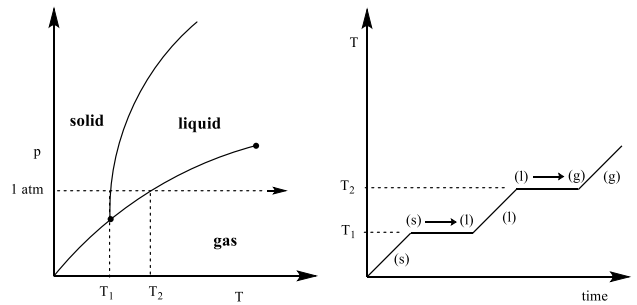
Understanding How a Phase Diagram and Heat Curve are Related
If we are given a phase diagram, we can construct a heat curve at a given pressure. To do this we must draw a horizontal line at P=1atm and remember that phase changes take energy and happen at a constant temperature.
Translating Phase Diagrams to Heating Curves
0:00 / 0:00
Example: Phase Diagrams

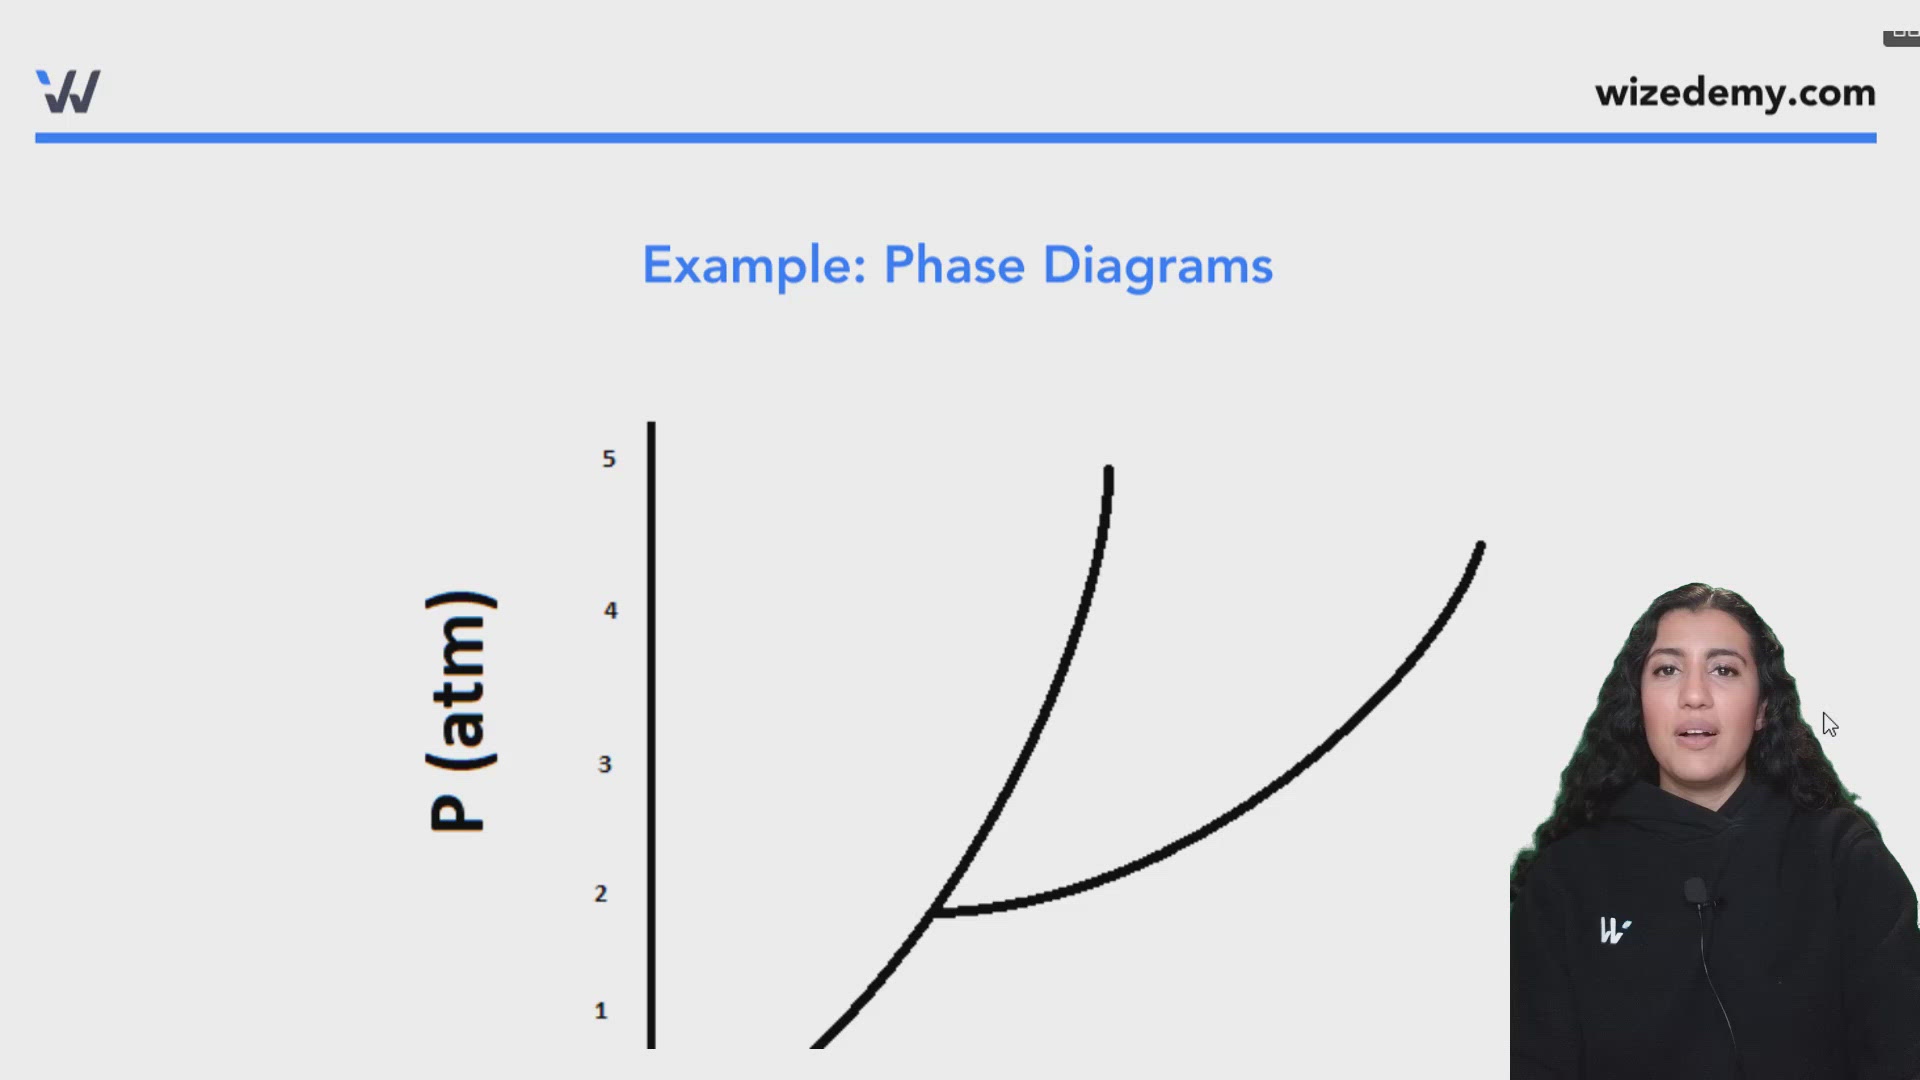
a) Using the phase diagram, can you determine whether the solid or liquid phase is more dense?
As the slope for the solid-liquid line is positive, it is expected that the solid will be more dense
b) What is the phase at 5 atm and 35 K?
At 35 K and 5 atm, we would expect to find a supercritical fluid (gas/liquid hybrid) since we are beyond the critical point.
c) At a pressure of 3 atm, what temperature range would you expect to find a gas?
At 3 atm, we would expect to find a gas at 20 K or higher.
d) At what approximate temperature and pressure would we expect to find the triple point?
We would expect to find the triple point at approximately 2 atm and 10 K
Practice: Identifying a Phase Change
Considering the following phase diagram

The process that describes the transition from a to b is
0:00 / 0:00
Example: Phase Diagrams
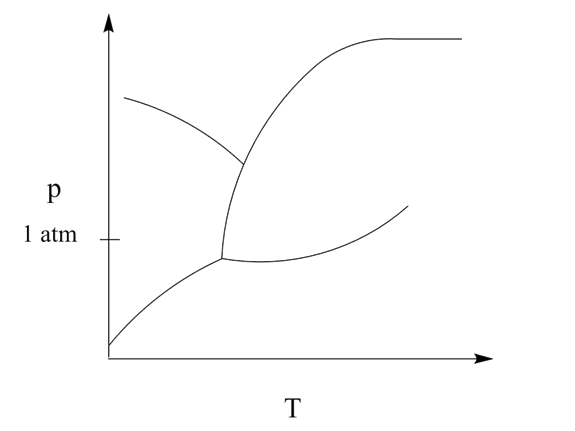
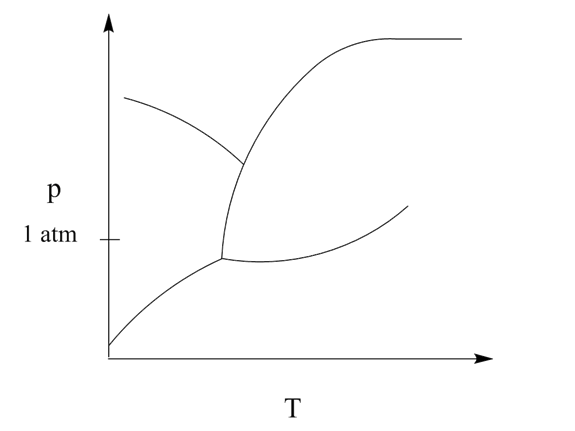
The phase diagram of Argon is shown below. Argon has two distinct solid phases α and β.
When the solid-α is more dense than solid-β.
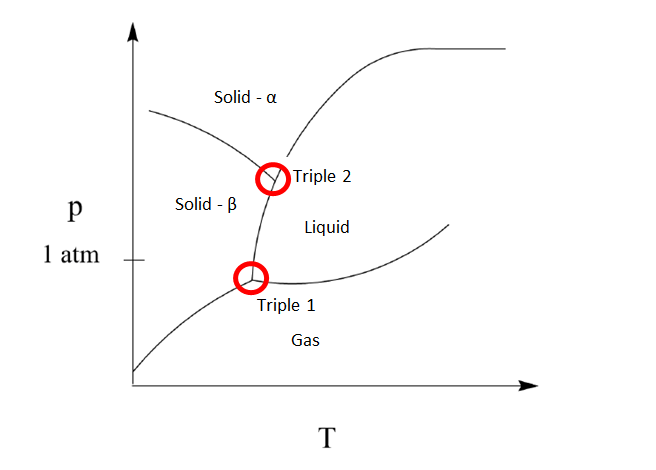
a) Label the phases on the diagram below.
b) Does argon have a normal fusion curve?
Argon has a normal fusion curve because the slope is positive. This means that solid is denser than liquid which makes it a normal fusion curve.
c) Can solid-β undergo sublimation? Explain your answer.
Solid – β can sublime because it shares a phase boundary with gas
d) Label the triple point(s) on the graph and describe what phases are present at those points
The triple points are indicated above. T1 contains solid – β, liquid and gas phases in equilibrium. T2 contains solid – α, solid – β, and liquid in equilibrium
Practice: Phase Diagrams
Refer to the phase diagram below for the following questions.
Which statements about this diagram are true?