Wize University Microeconomics Textbook > Theory of Consumer Choice
Work - Leisure Choices
Popular Courses
Microeconomics
University Study Guides
ECON 1050
University of Guelph
ECON 101
University of Alberta
Microeconomics
General Course
ECO101H1
University of Toronto
Microeconomics
University Study Guides
ECON 101
University of Waterloo
ECON 110A
Queen's University
ECN 104
Toronto Metropolitan University
ECON 111
Queen's University
ECON 103
Simon Fraser University
ECON-1100
University of Windsor
MET EC 101
Boston University
ECON-B 251
Indiana University - Bloomington
ECN 101
Toronto Metropolitan University
ECON 1010
University of Manitoba
ECON 102
University of Illinois at Urbana - Champaign
ECON 1001
Carleton University
ECON 101
University of Delaware
ECON 1101
University of Minnesota
0:00 / 0:00
Work - Leisure Choices
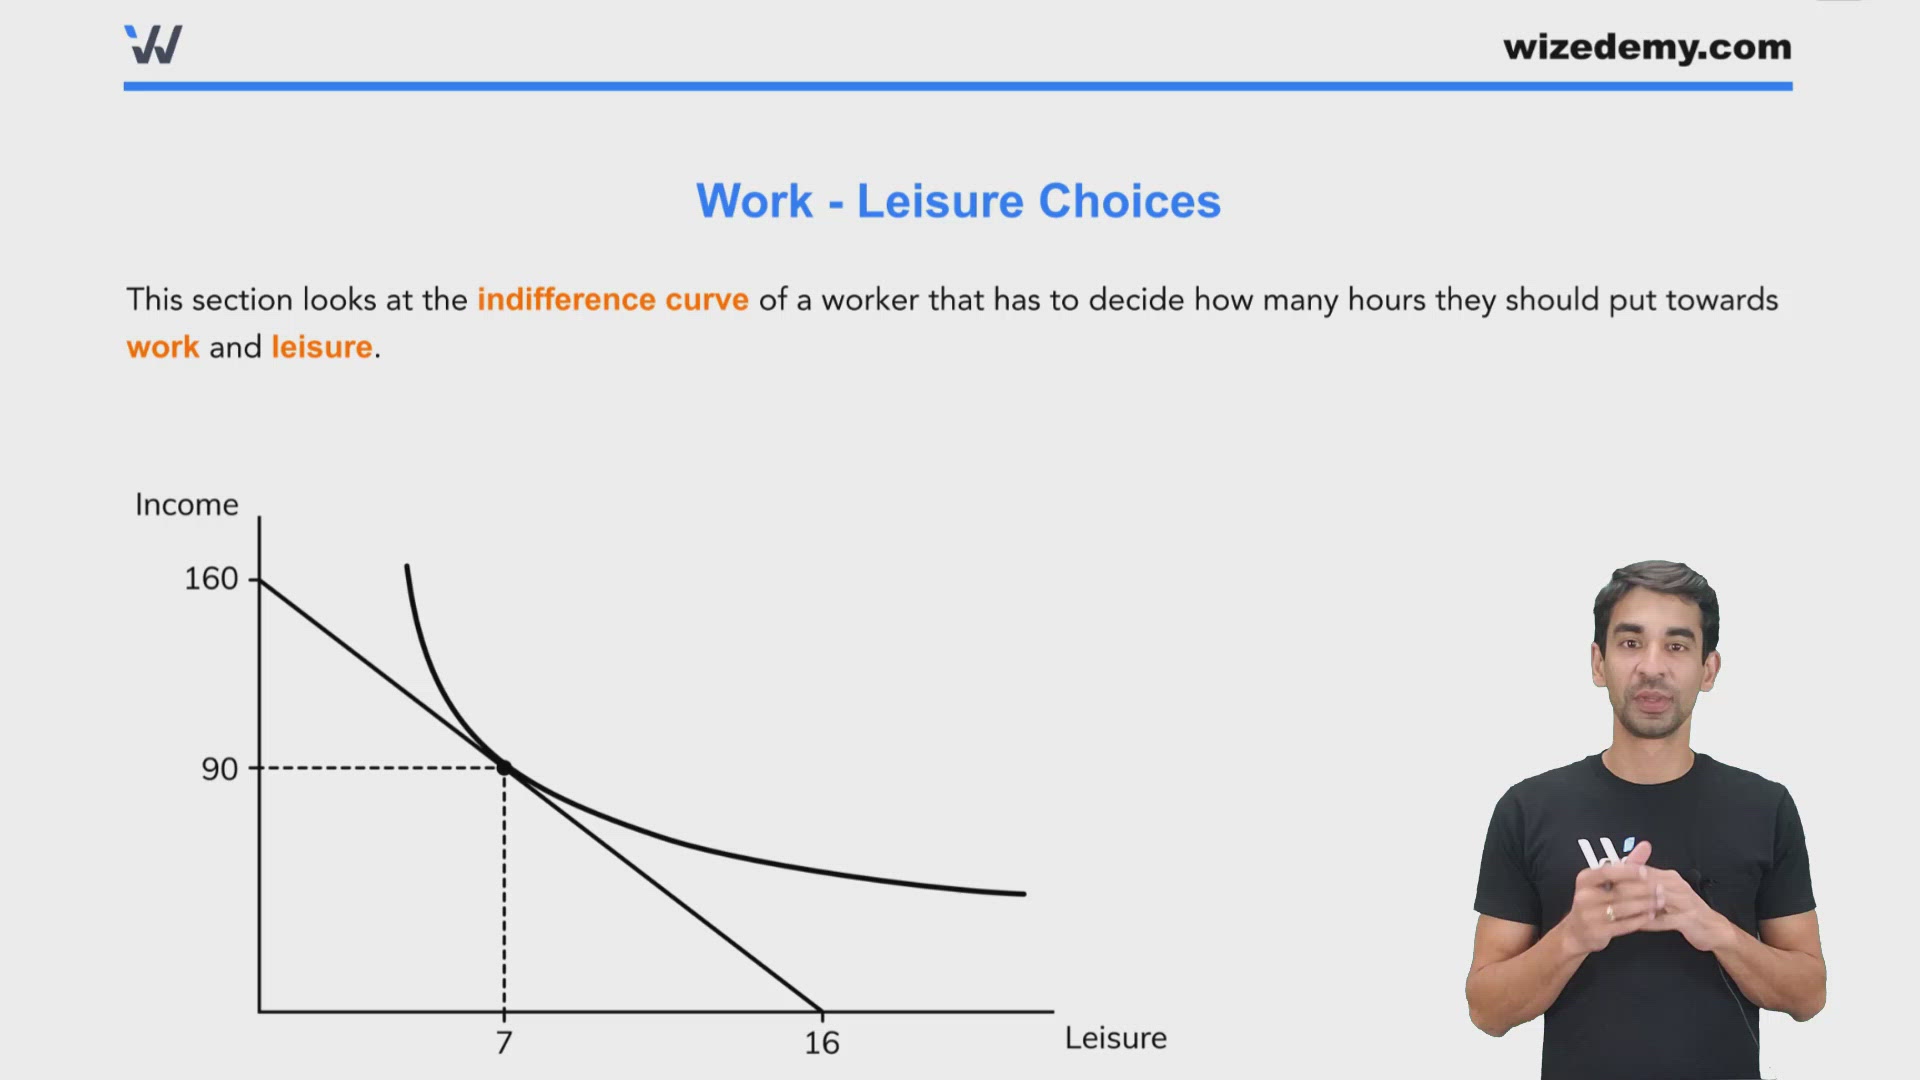
This section looks at the indifference curve of a worker that has to decide how many hours they should put towards work and leisure.

- In the diagram above, as the worker consumes more leisure it means they are working less and therefore earning less income.
- The budget constraint shows the different combinations of leisure and income that the worker can actually afford at their current job. Usually, the horizontal intercept is 16 hours (24 - 8) because the average person spends 8 out of the 24 hours in a day sleeping.
- The wage is160/16 = $10
- The point where the budget constraint is tangent to the indifference curve is the utility maximization (optimal) point. In the diagram this would be at7hours of leisure and an income of$90
- Everyone has their own utility maximization (optimal) point depending on how much they value leisure and money.

0:00 / 0:00
Example: Work - Leisure Choices
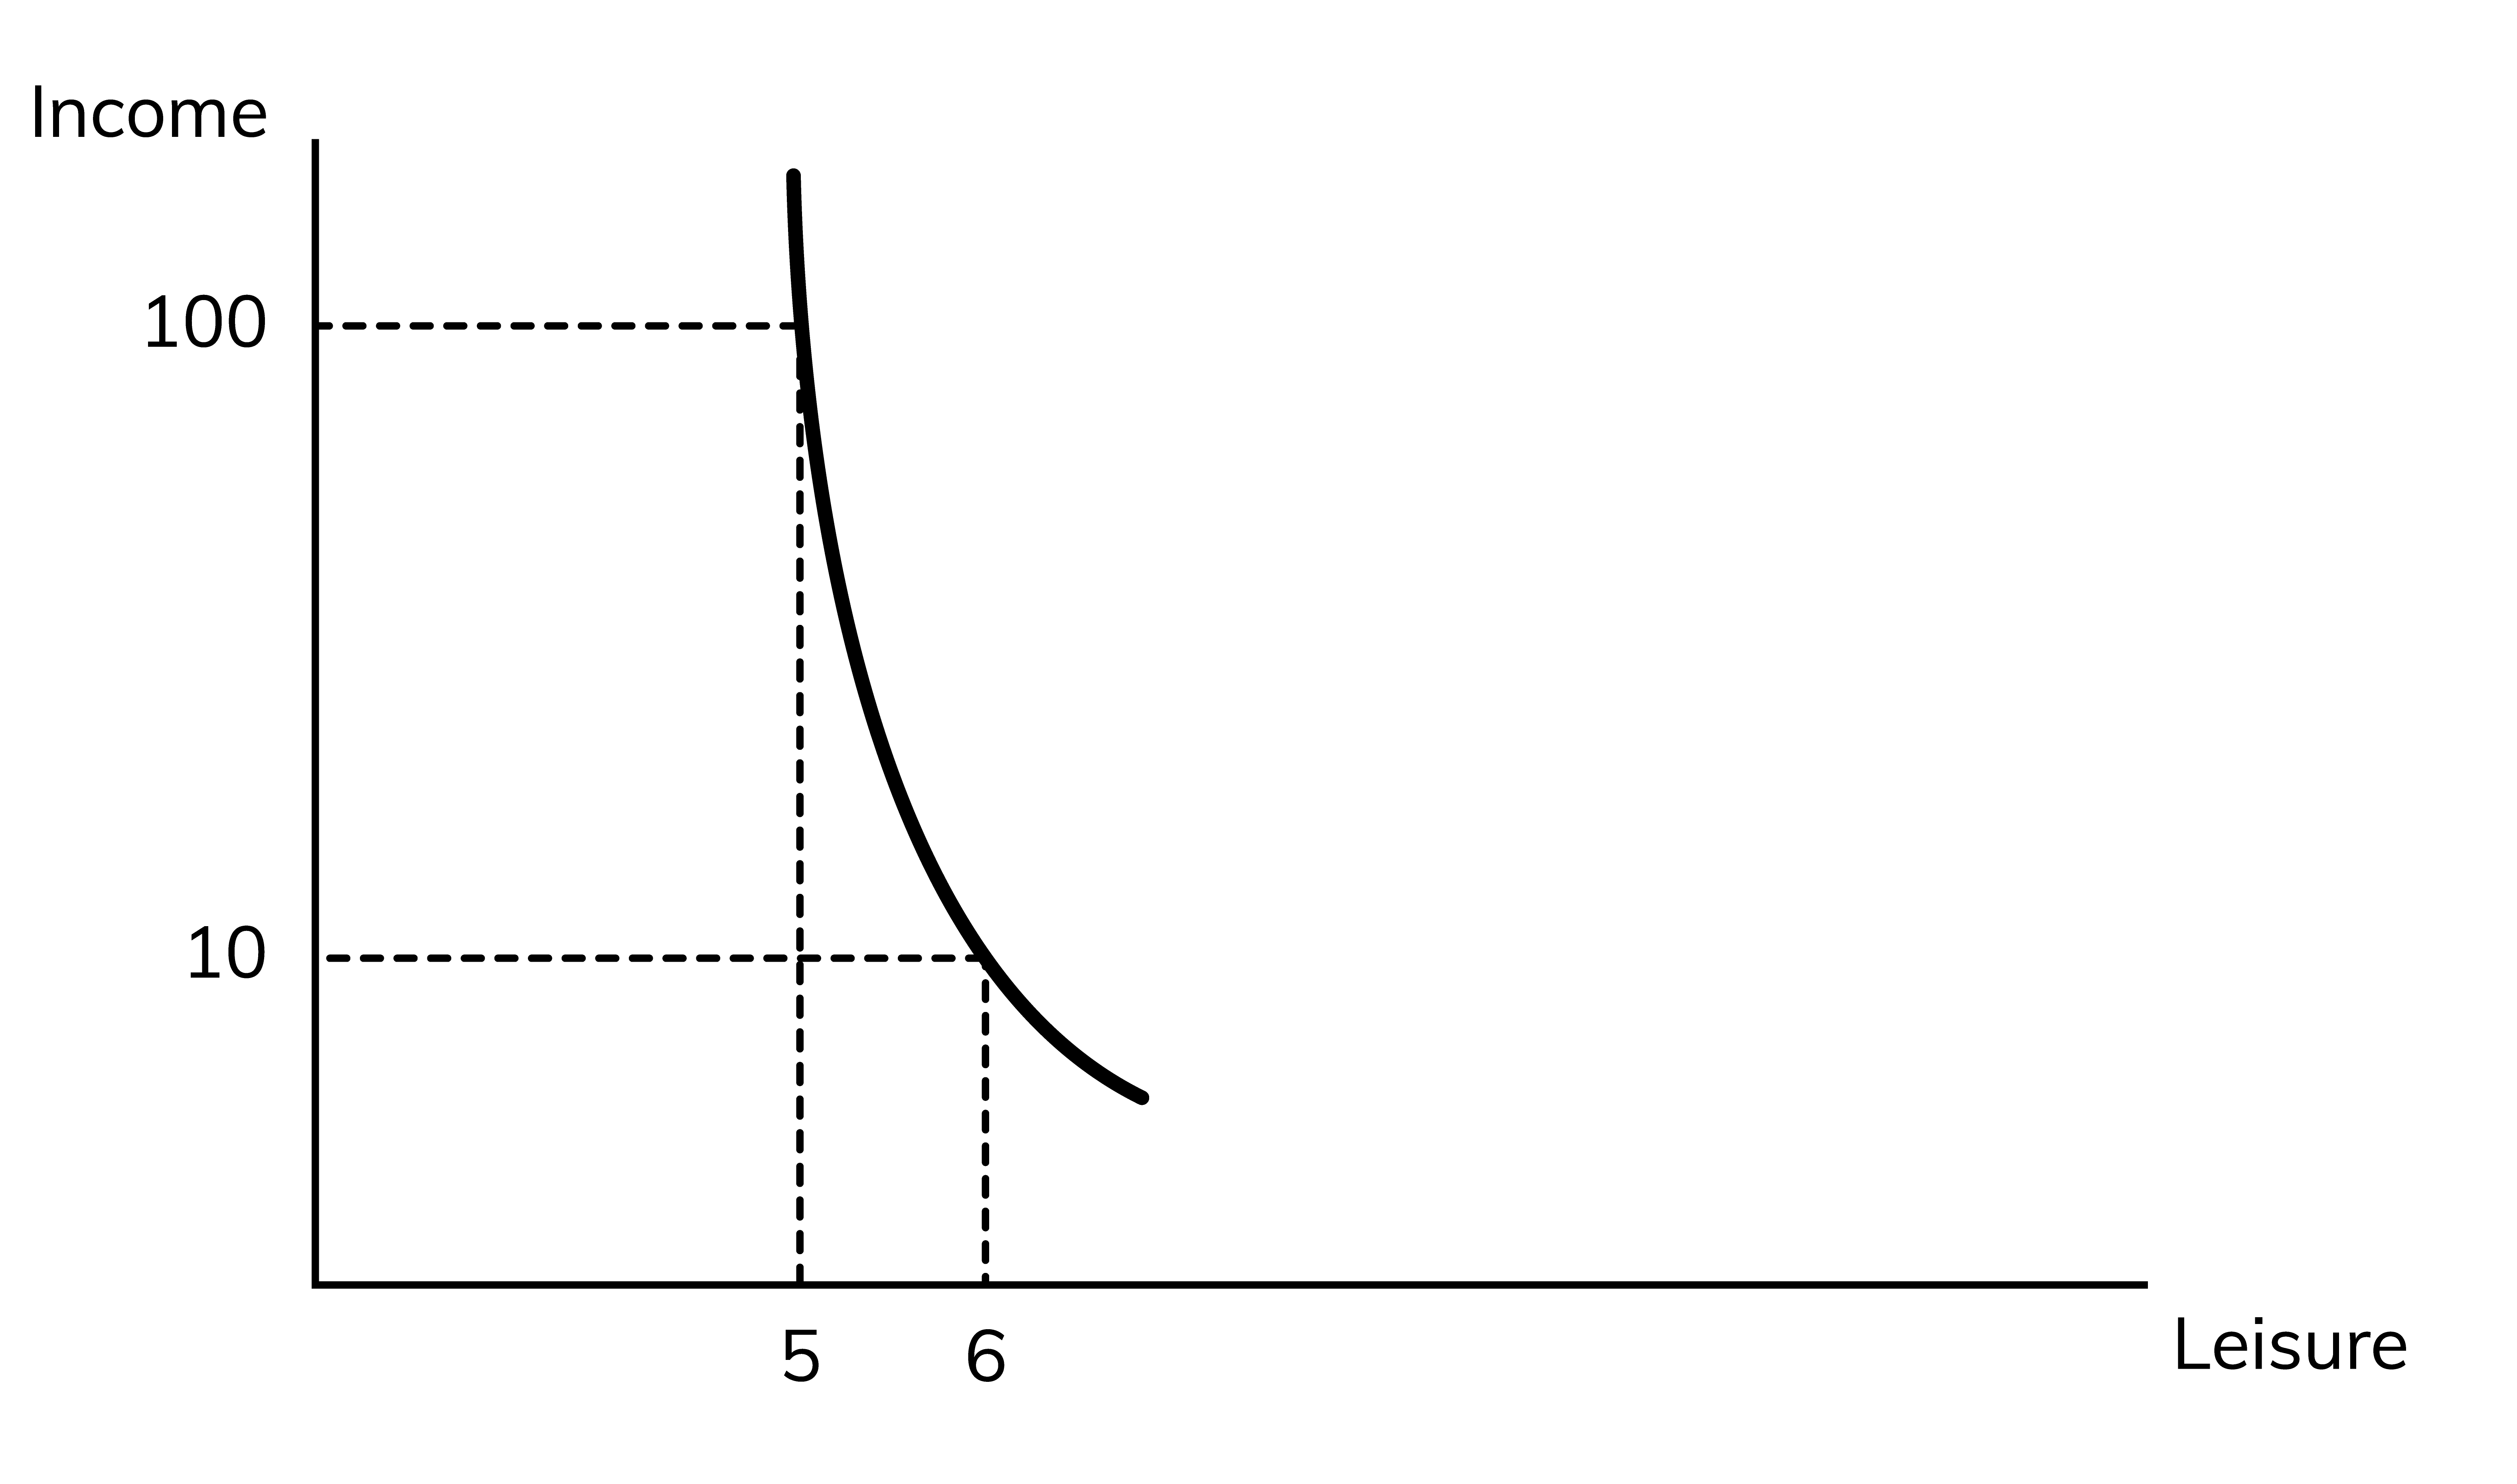
Jamal
Jenny
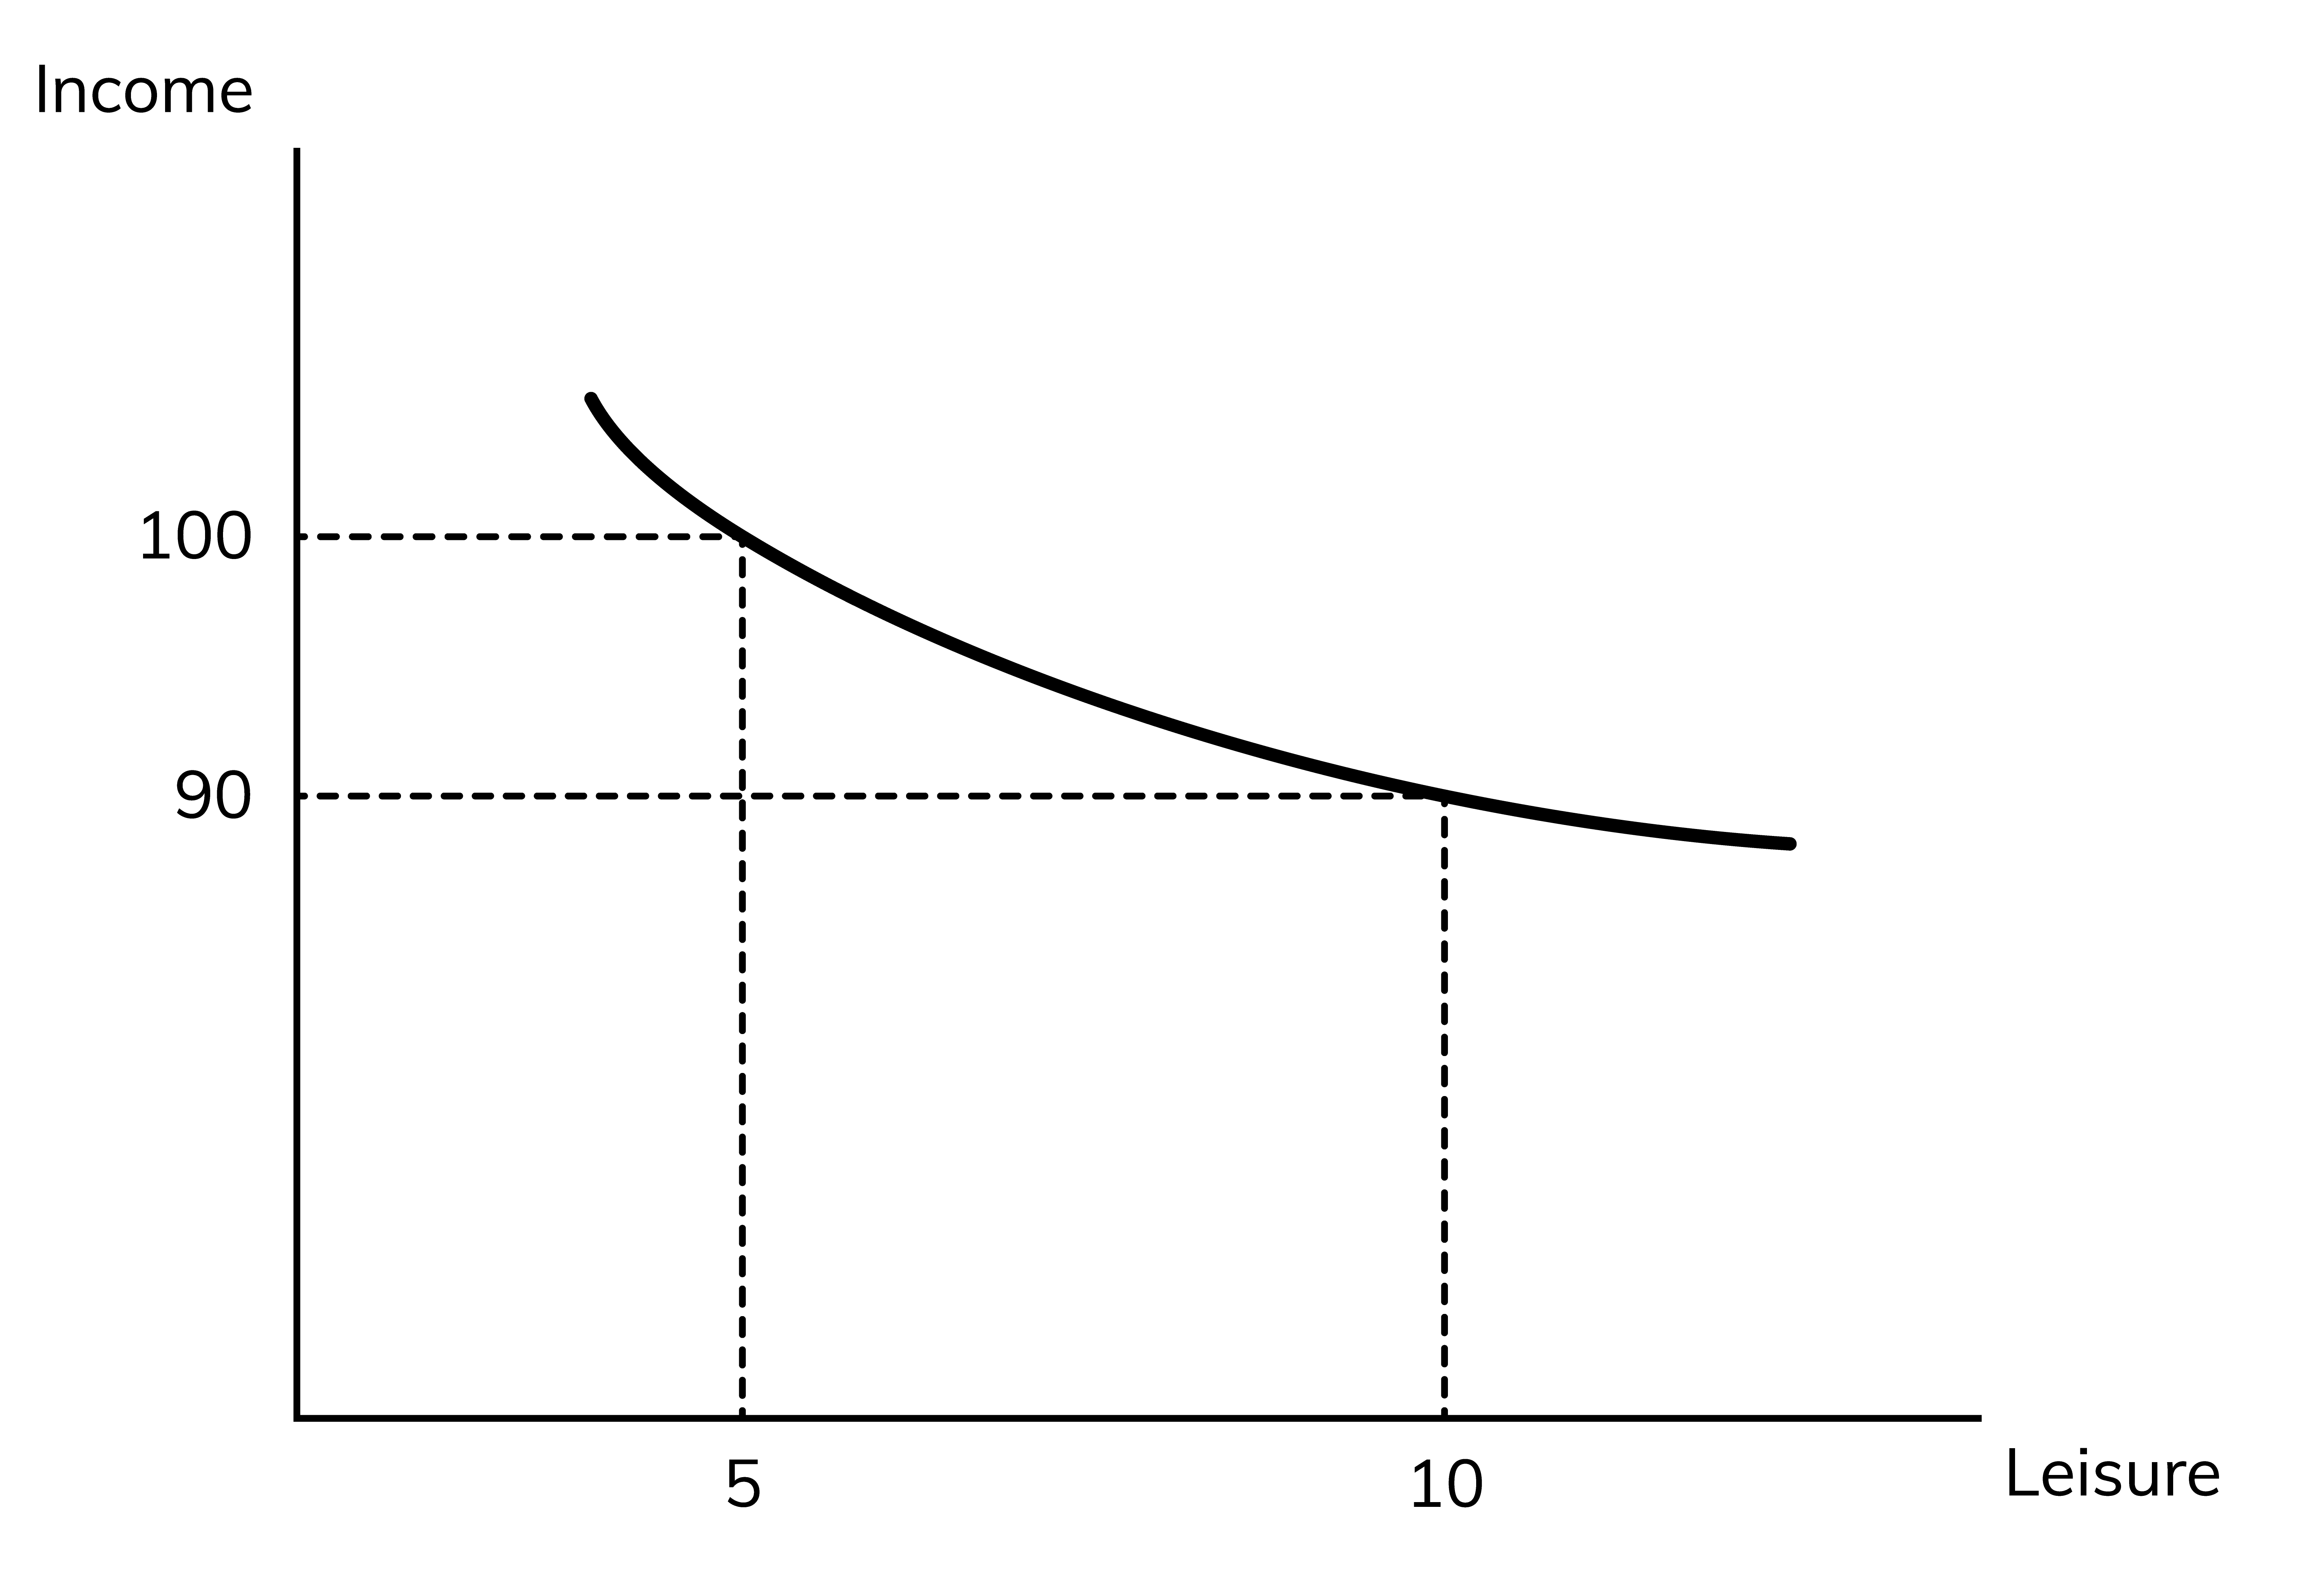
With the indifference curves above, we can say Jamal values leisure:
A) more than Jenny
B) less than Jenny
C) the same as Jenny
D) cannot be determined
A.
Jamal has a steeper indifference curve. This means he is willing to give up a lot of income (100 - 10 = $90) for 1 extra hour of leisure. Jenny is only willing to give up a little bit of income (100 - 90 = $10) for more leisure. This shows that Jamal values leisure more.