Wize University Introduction to Finance Textbook > Risk, Return & Portfolio Theory
Portfolio Standard Deviation (Special Cases)
Popular Courses
COMM 308
Concordia University
Intro to Finance
University Study Guides
Intro to Finance
University Study Guides
FINA 230
Concordia University
MGCR 341
McGill University
FIN 301
University of Alberta
FIN 300
Toronto Metropolitan University
COMM 121
Queen's University
FIN*2000
University of Guelph
FINC 341
Texas A&M University
COMM 2202
Dalhousie University
BU283
Wilfrid Laurier University
FIN 300
Arizona State University - Tempe
BUSFIN 3220
Ohio State University
SB/FINE 2000 3.00
York University
FIN 301
Pennsylvania State University
BUS-F 255
Indiana University - Bloomington
FIN 3403
University of Central Florida
FIN 3403
University of Florida
FIN 320
California State University - Fullerton
0:00 / 0:00
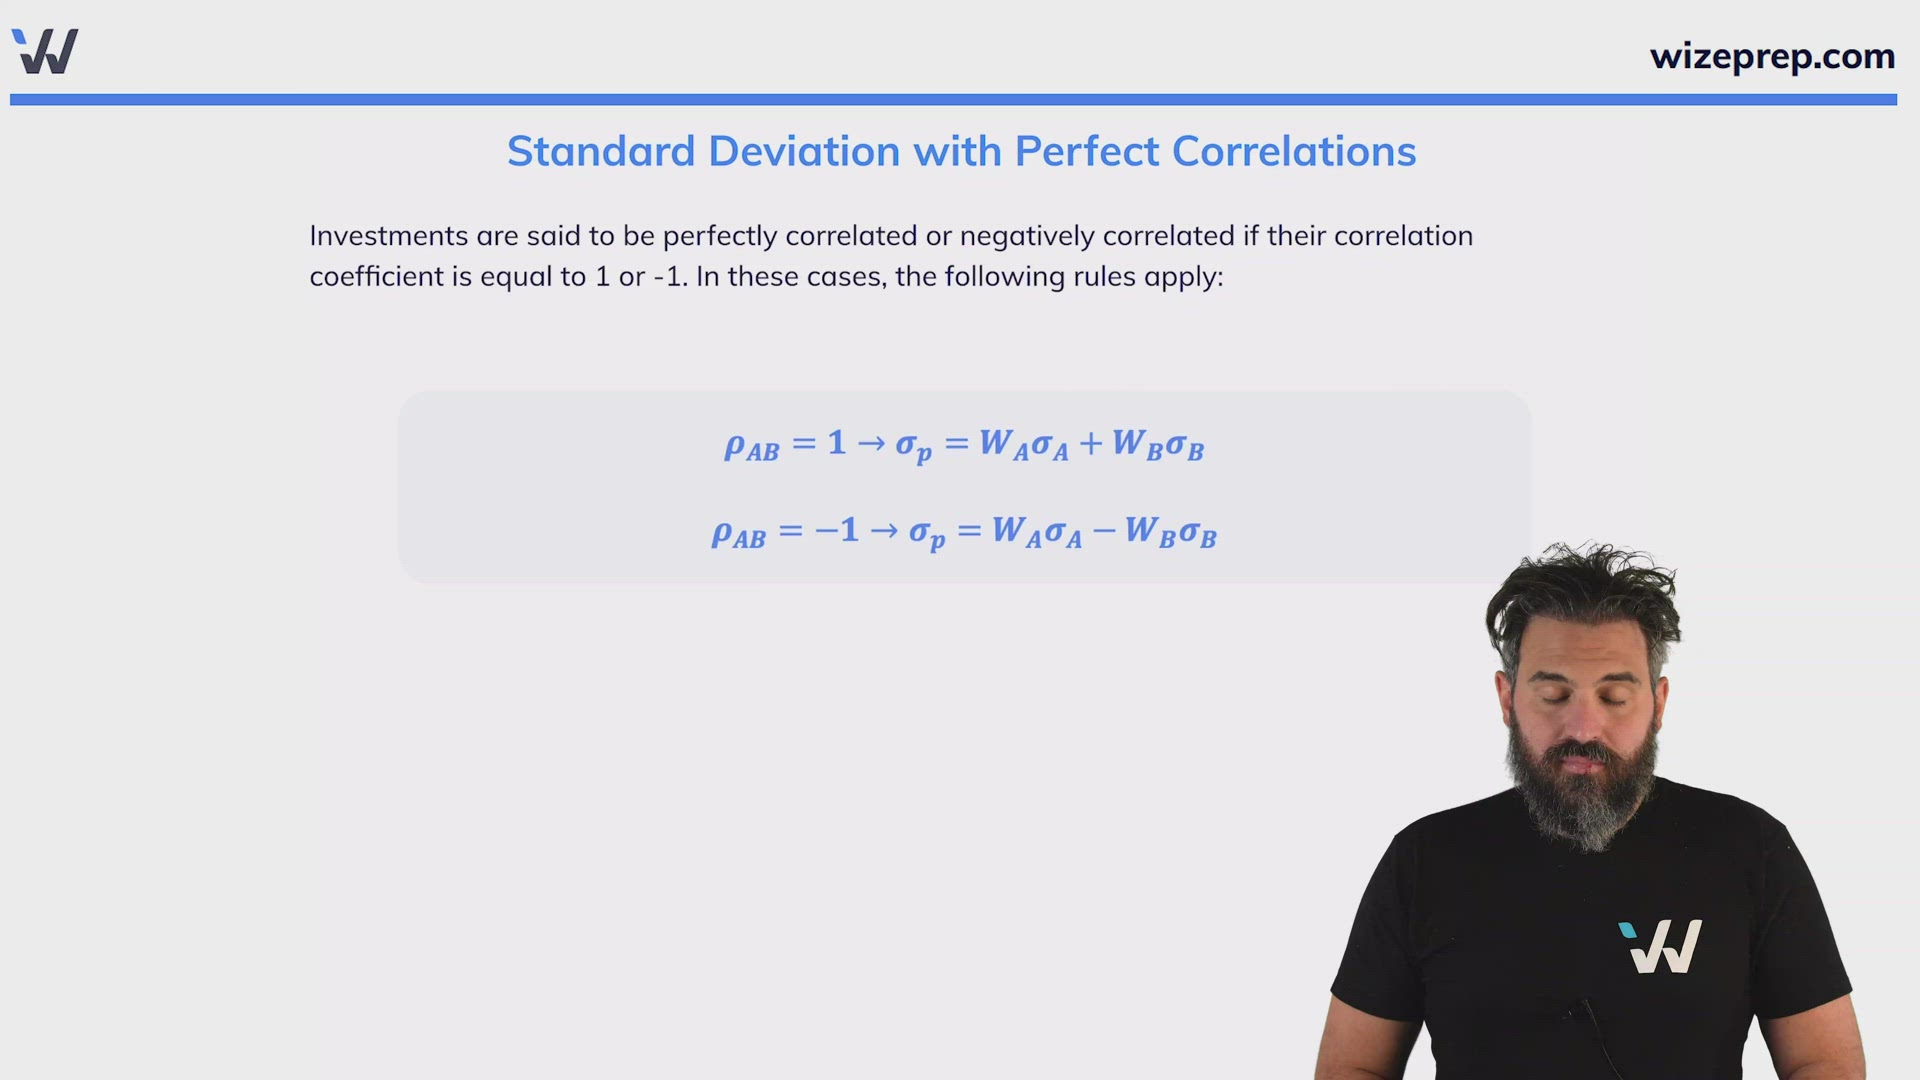
Standard Deviation with Perfect Correlations
Investments are said to be perfectly correlated or negatively correlated if their correlation coefficient is equal to 1 or -1. In these cases, the following rules apply:

0:00 / 0:00
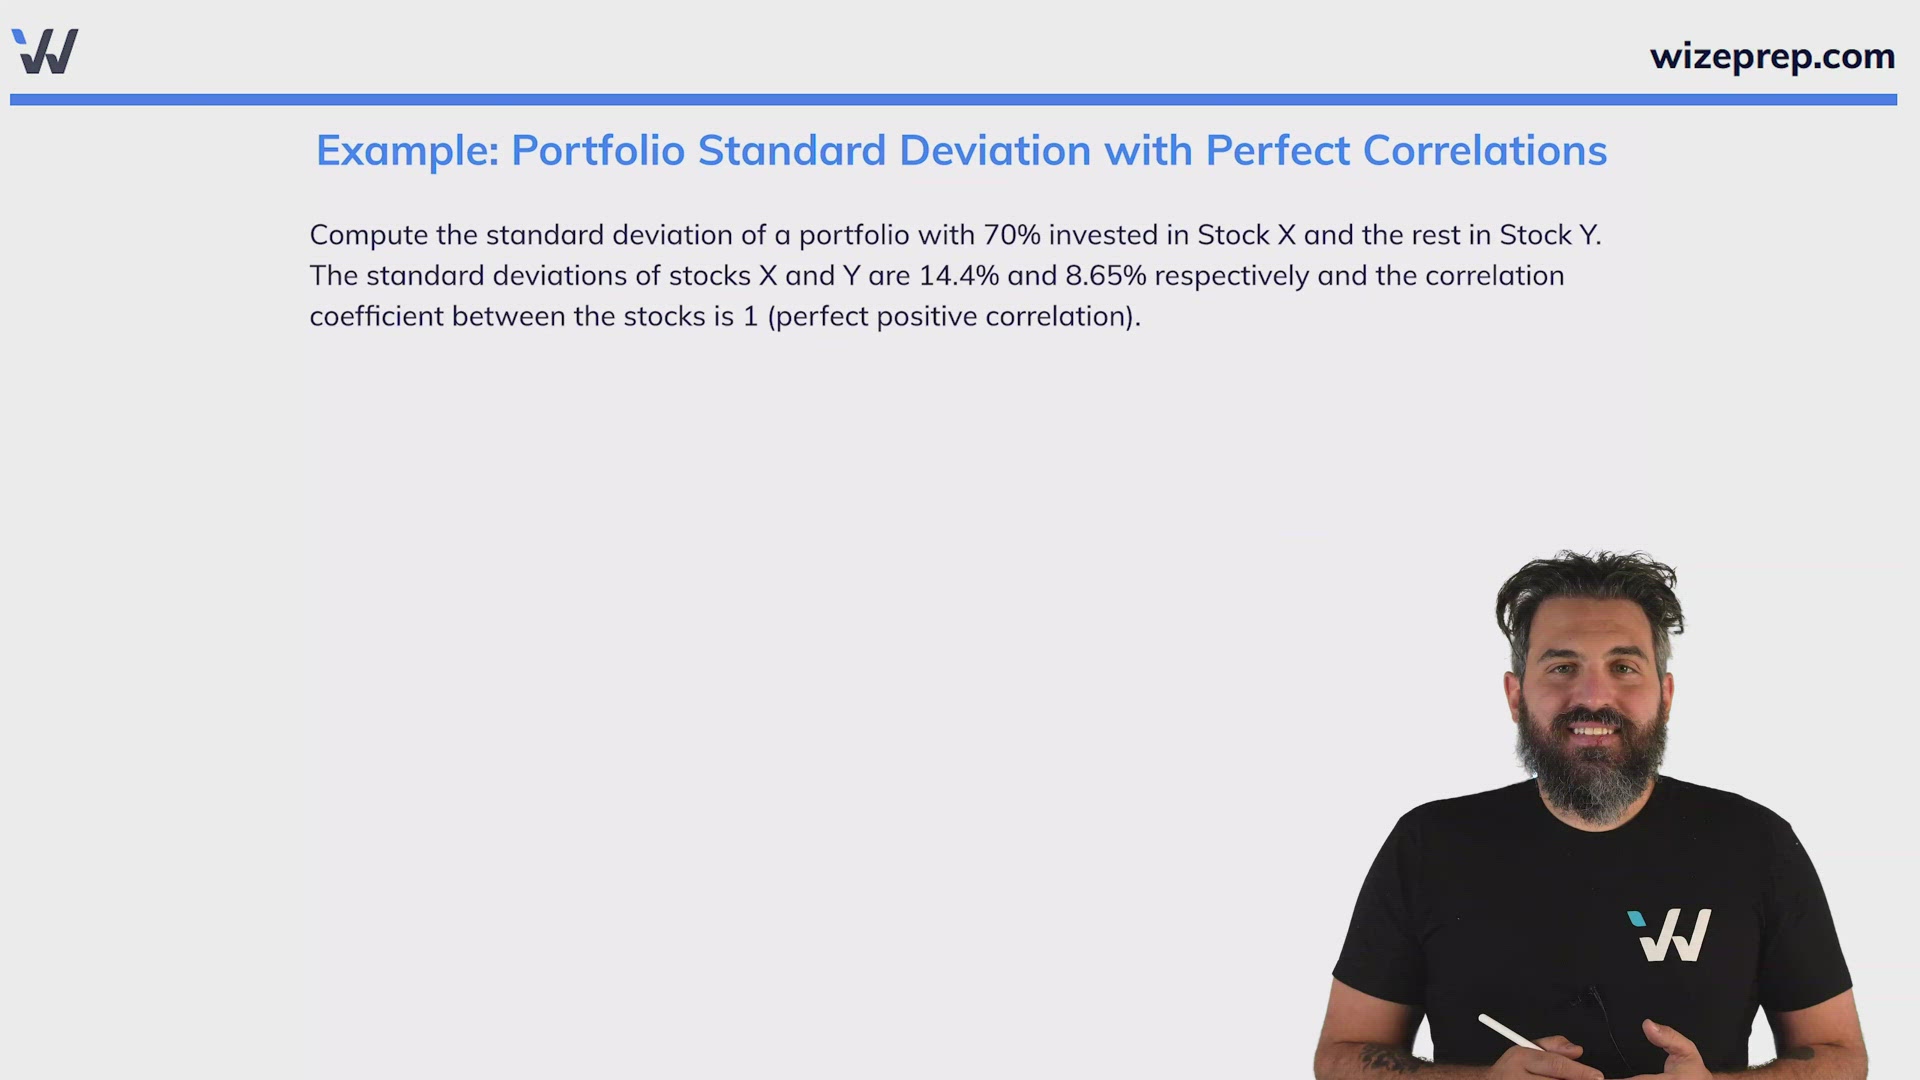
Example: Portfolio Standard Deviation with Perfect Correlations
Compute the standard deviation of a portfolio with 70% invested in Stock X and the rest in Stock Y. The standard deviations of stocks X and Y are 14.4% and 8.65% respectively and the correlation coefficient between the stocks is 1 (perfect positive correlation).
Practice: Portfolio Standard Deviation with Perfect Correlations
The standard deviation of a portfolio containing stocks G and F is 8.95%. Stock G has a standard deviation of 7.5% and stock F has a standard deviation of 12%. Stocks G and F have a perfect positive correlation. If the portfolio has $10,000 in it, how much of that is invested in stock G?
Round your final answer to 2 decimal places.
| Amount invested in Stock G | $ |

0:00 / 0:00
Standard Deviation with No Correlation
When two stocks are said to be completely unrelated, this means that the covariance and correlation between them is 0.

0:00 / 0:00
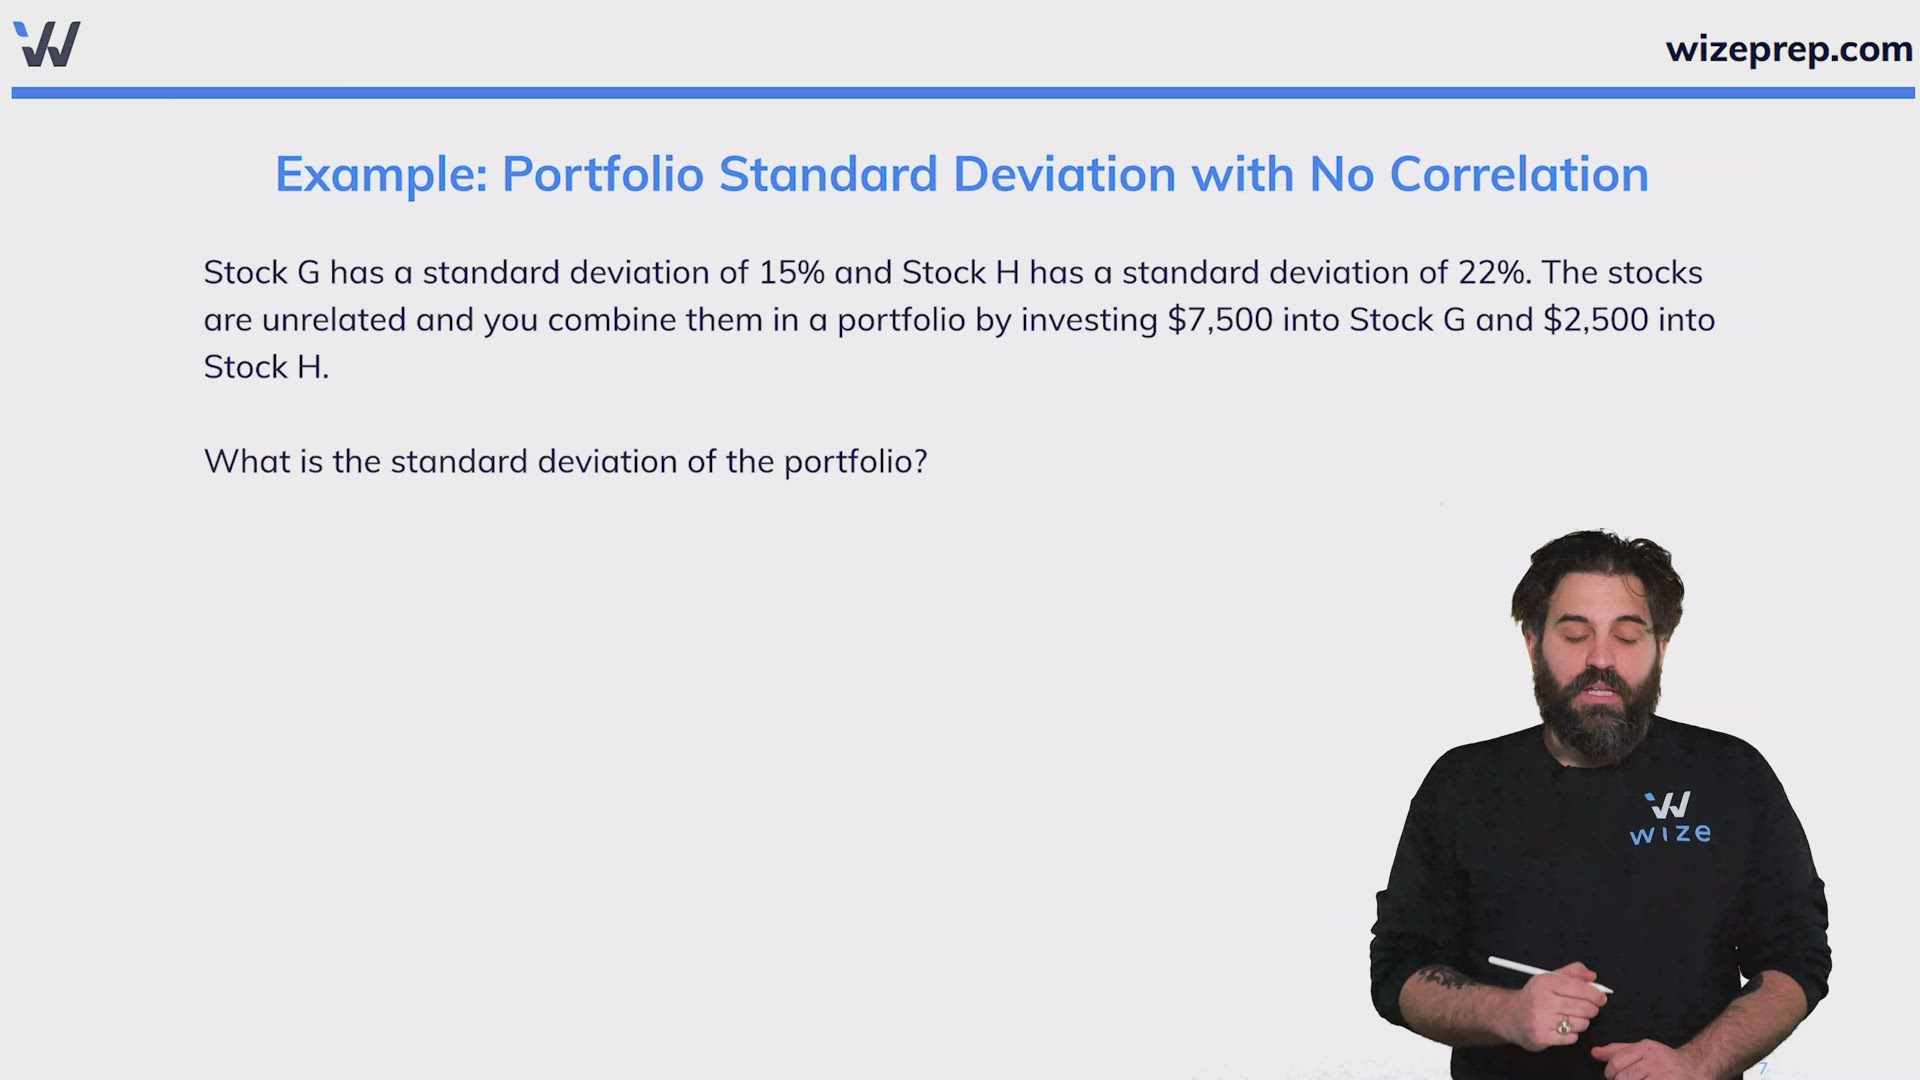
Example: Portfolio Standard Deviation with No Correlation
Stock G has a standard deviation of 15% and Stock H has a standard deviation of 22%. The stocks are unrelated and you combine them in a portfolio by investing $7,500 into Stock G and $2,500 into Stock H.
What is the standard deviation of the portfolio?
Practice: Portfolio Standard Deviation with No Correlation
You've constructed a portfolio with a standard deviation of 18.4% using two completely unrelated stocks, Stocks A and B. The portfolio contains twice as much Stock A as it does Stock B. If the standard deviation of Stock A is 15%, what is the standard deviation of stock B?
Round your final answer to 2 decimal places
| Standard deviation of Stock B | % |
0:00 / 0:00
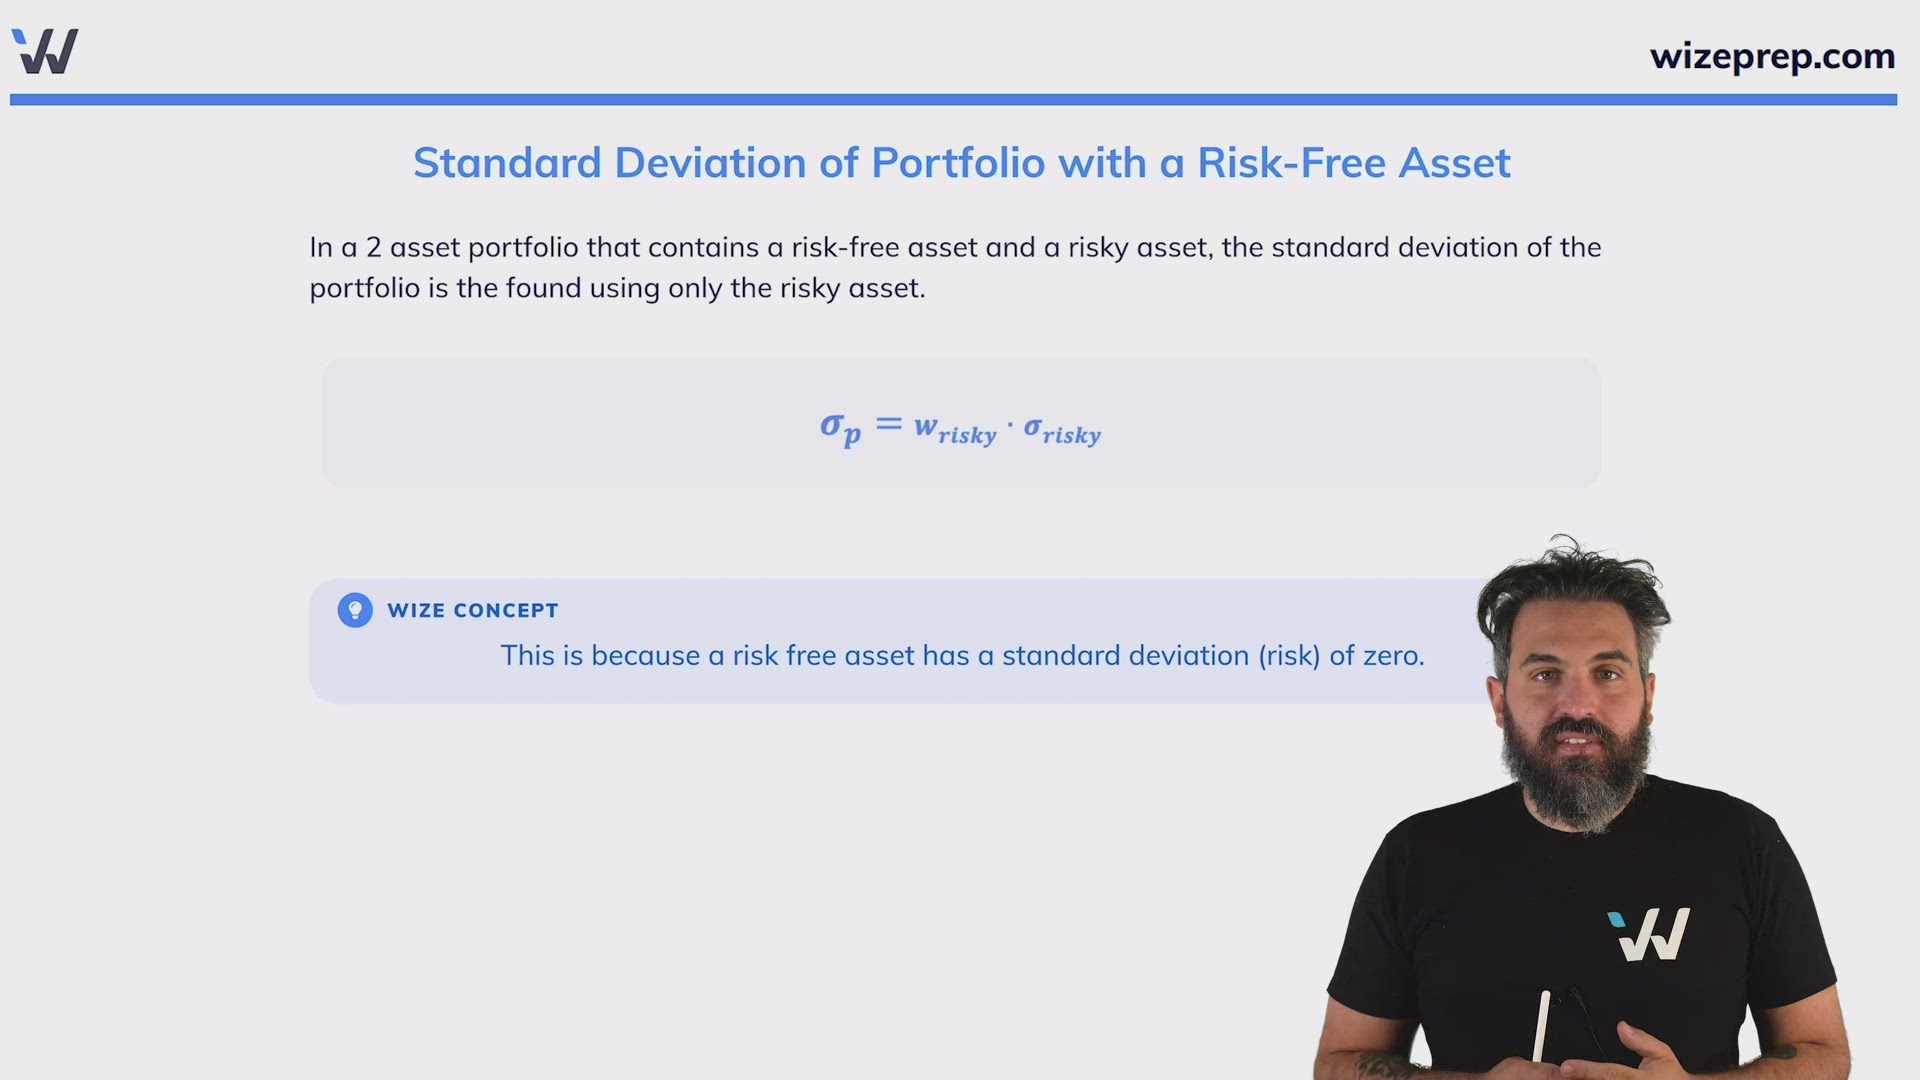
Standard Deviation of Portfolio with a Risk-Free Asset
In a 2 asset portfolio that contains a risk-free asset and a risky asset, the standard deviation of the portfolio is the found using only the risky asset.

Wize Concept
This is because a risk free asset has a standard deviation (risk) of zero.
0:00 / 0:00
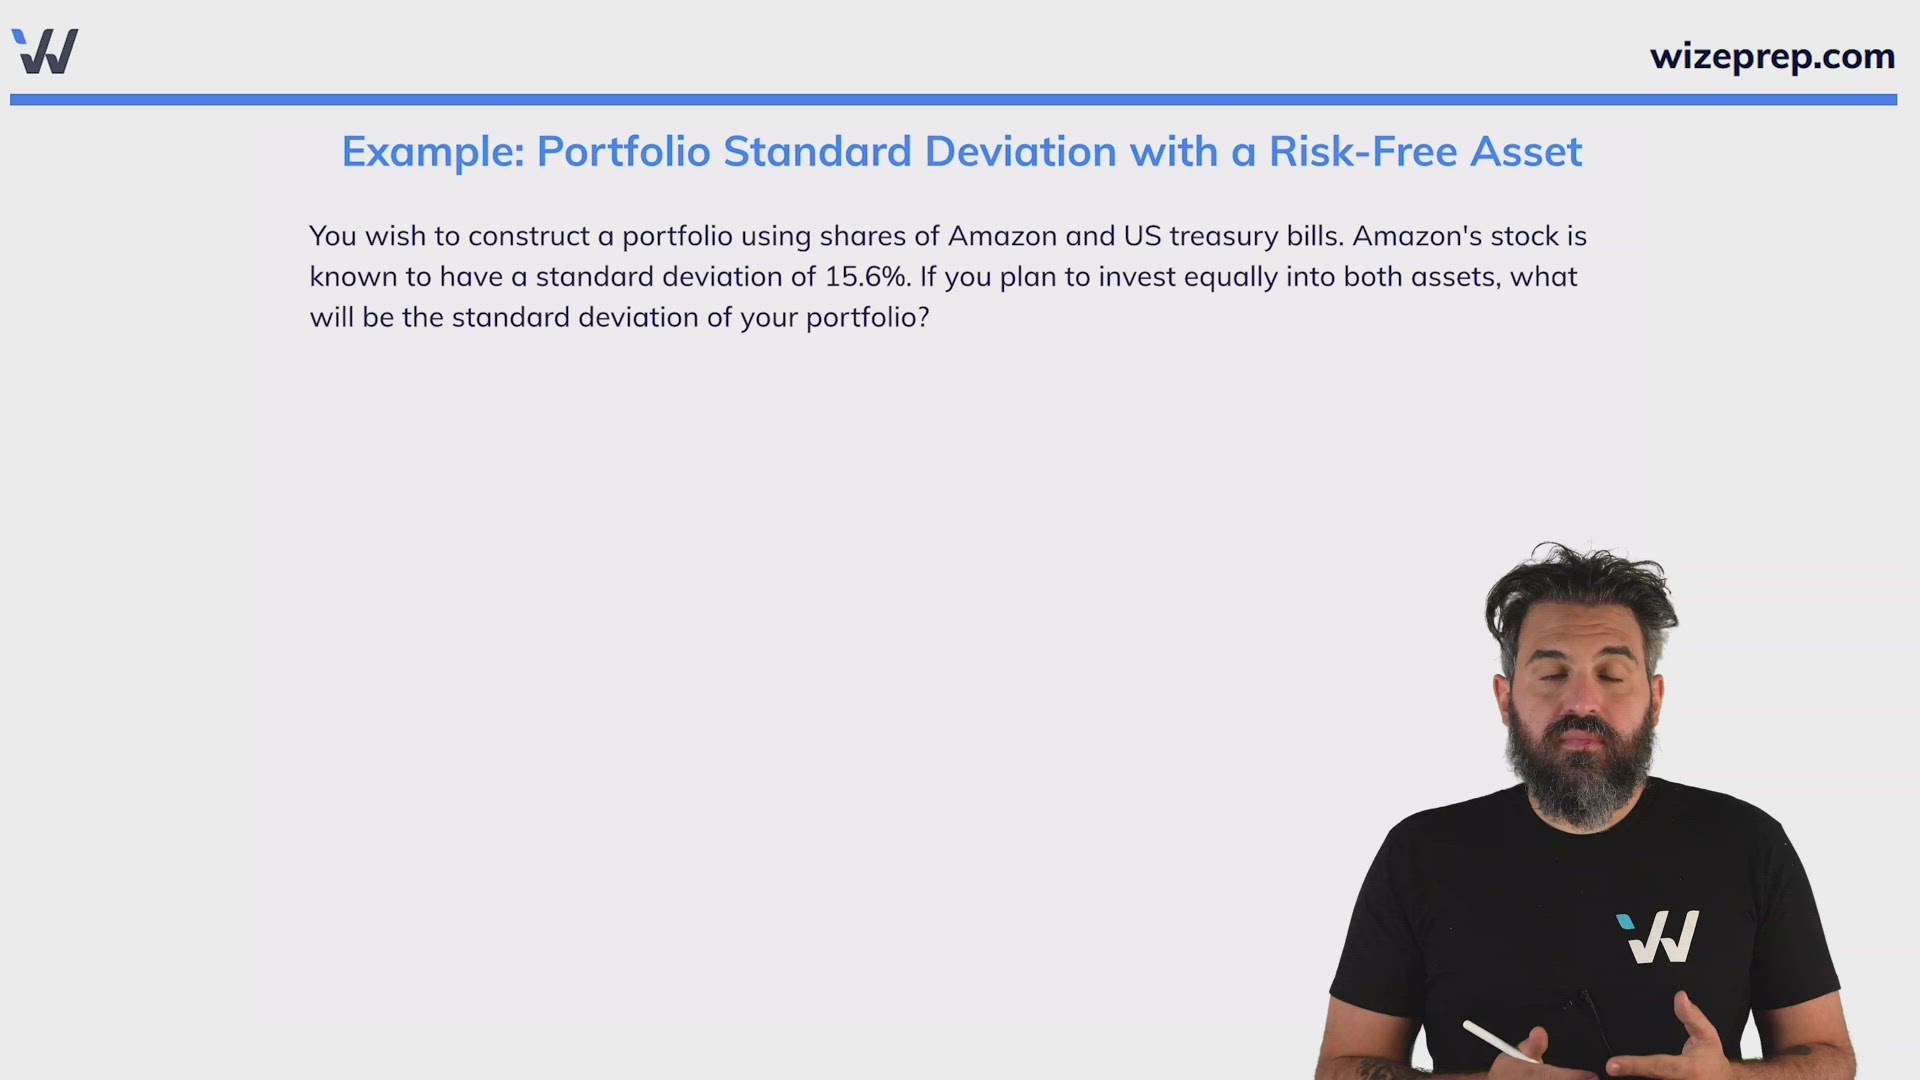
Example: Portfolio Standard Deviation with a Risk-Free Asset
You wish to construct a portfolio using shares of Amazon and US treasury bills. Amazon's stock is known to have a standard deviation of 15.6%. If you plan to invest equally into both assets, what will be the standard deviation of your portfolio?
Practice: Portfolio Standard Deviation with a Risk-Free Asset
You've constructed a portfolio with a standard deviation of 25% using Apple Inc.'s stock and US treasury bills. The standard deviation of Apple's stock is 22%. What percentage of your portfolio is invested in Apple's stock and what percentage is invested in the treasury bills?
Round your final answer to 2 decimal places
| Weight of Apple stock | % | |
| Weight of Treasury Bills | % |