Wize University Introduction to Finance Textbook > Risk, Return & Portfolio Theory
Ex-Post Standard Deviation
Popular Courses
COMM 308
Concordia University
Intro to Finance
University Study Guides
Intro to Finance
University Study Guides
FINA 230
Concordia University
MGCR 341
McGill University
FIN 301
University of Alberta
FIN 300
Toronto Metropolitan University
COMM 121
Queen's University
FIN*2000
University of Guelph
FINC 341
Texas A&M University
COMM 2202
Dalhousie University
BU283
Wilfrid Laurier University
FIN 300
Arizona State University - Tempe
BUSFIN 3220
Ohio State University
SB/FINE 2000 3.00
York University
FIN 301
Pennsylvania State University
BUS-F 255
Indiana University - Bloomington
FIN 3403
University of Central Florida
FIN 3403
University of Florida
FIN 320
California State University - Fullerton

0:00 / 0:00
Measuring Risk
Risk implies that an outcome is not certain, the way we quantify risk in this context is by measuring the standard deviation. To compute the standard deviation of returns that have already occurred (historical) use the following formula:

Formula breakdown:

Alternatively, you can use your Texas Instrument financial calculator to solve it.
How to Compute Standard Deviation on Financial Calculator

Formula breakdown:
R1, R2, R3 = Individual returns (as many as necessary)
0:00 / 0:00
Example: Standard Deviation
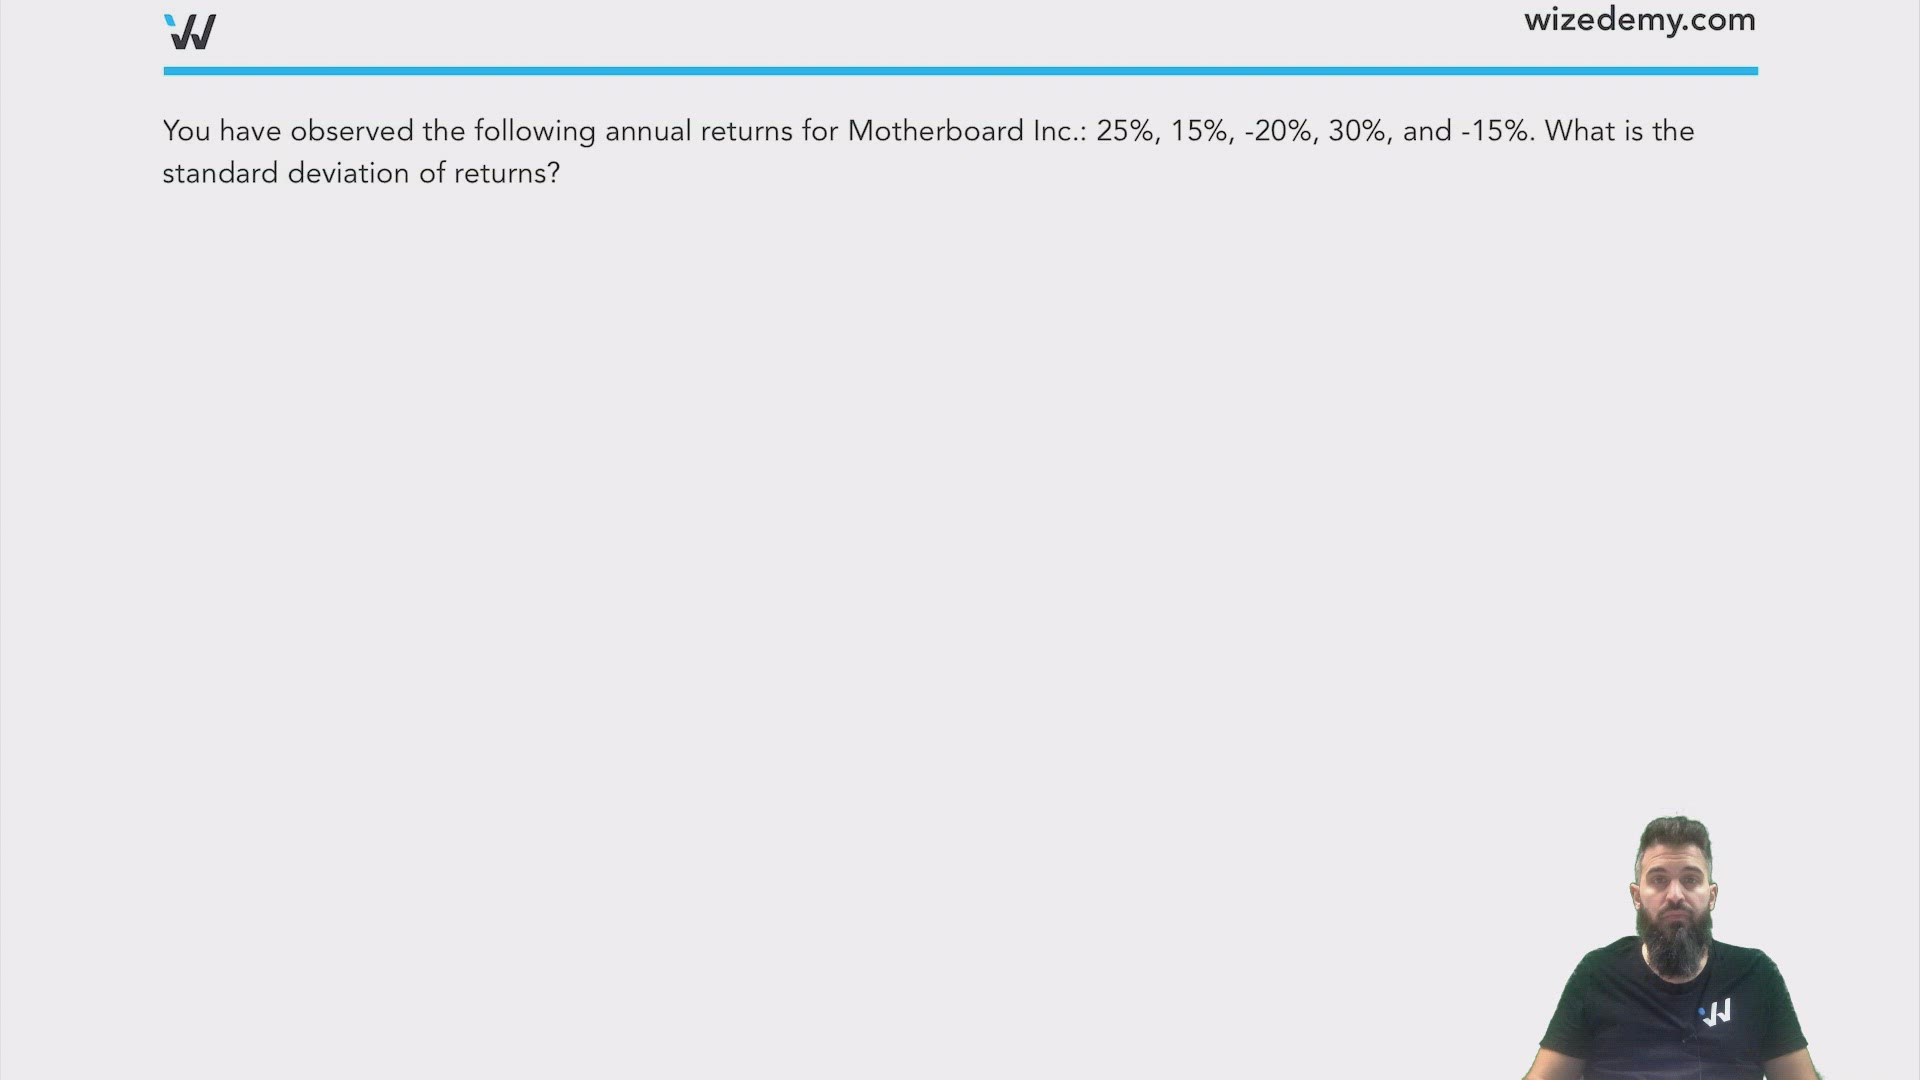
You have observed the following annual returns for Motherboard Inc.: 25%, 15%, -20%, 30%, and -15%.
What is the standard deviation of returns?

Mark Yourself Question
- Grab a piece of paper and try this problem yourself.
- When you're done, check the "I have answered this question" box below.
- View the solution and report whether you got it right or wrong.
Practice: Standard Deviation
A stock has year-end prices and dividends as below.

a) What is the Arithmetic Average return?
b) What is the Geometric Average return?
c) What is the standard deviation of returns?